Filtering, sorting & grouping
Filtering, sorting and grouping give you a powerful way to see the data that matters to you in the way you want to see it. Watch a video about this here:
Bear in mind that this video was filmed using the Classic layout. Although it looks slightly different, all the functionality is the same in our new layout.
To learn more about each, check out the sections below (click the arrow at the left side of the title to open each section). Also view Navigating your account to learn more about the other buttons that show above each view type.
Filtering
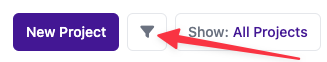
All views include a way to filter the data that shows within that view. To filter your data click on the filter button. This usually shows as the left most white button on the buttons row.
When you click on this you'll be shown a popup with the filter options for that page. Here is an example of the filter options popup for the projects list view:
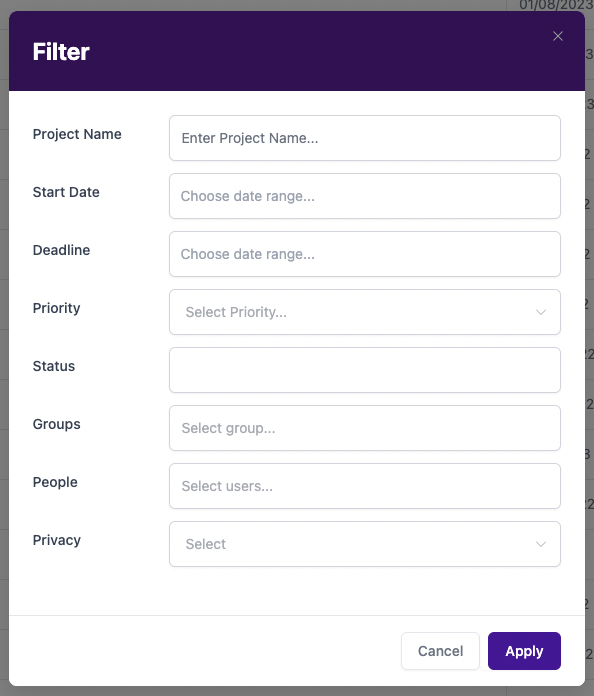
Edit the filter inputs to define which values you would like to filter to.
When you have saved your filter settings a chip will show below the button row for each filter you have applied. For example:
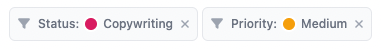
This makes it clear what filters you have active at any time.
You can quickly remove one of the filters by clicking the "X" at the right hand side of the filter chip. Or you can click one of the filter chips to re-open the filter popup.
Sorting
All views give you a way to sort your data. Sorting determines what order your data shows in the view and which field the sorting is based on.
To sort your data hover over the "Sort" button at the top of the view in the buttons row. For example, here is the projects list sorting options:
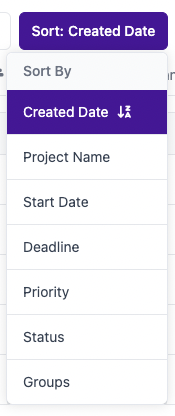
Click once on an item to sort by that field. For example, clicking on "Project Name" in the example above would sort the data by project name.
If you click on the same item again it alternates the sort direction from ascending to descending.
If you hold shift on your keyboard and then click on a 2nd item it will sort by multiple fields. For example, if you wanted to sort by a custom field "Priority" and then by "Created Date" you could click "Priority" and the hold shift on your keyboard and click on "Created Date" and you'd see this:
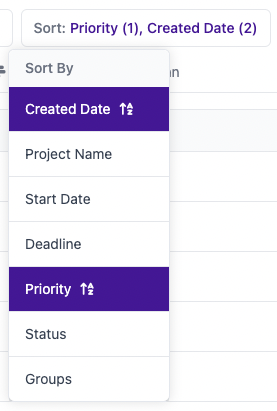
This gives you detailed control over how your data is presented in each view.
Grouping
Many of the view types give you the option to group your data. Grouping combines similar data together into one location to make it easier to view.
To group your data hover over the "Group" button in the buttons row at the top of the view. For example, this is what the group button looks like on the projects list page:
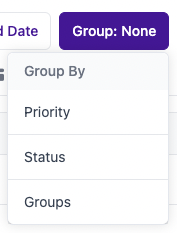
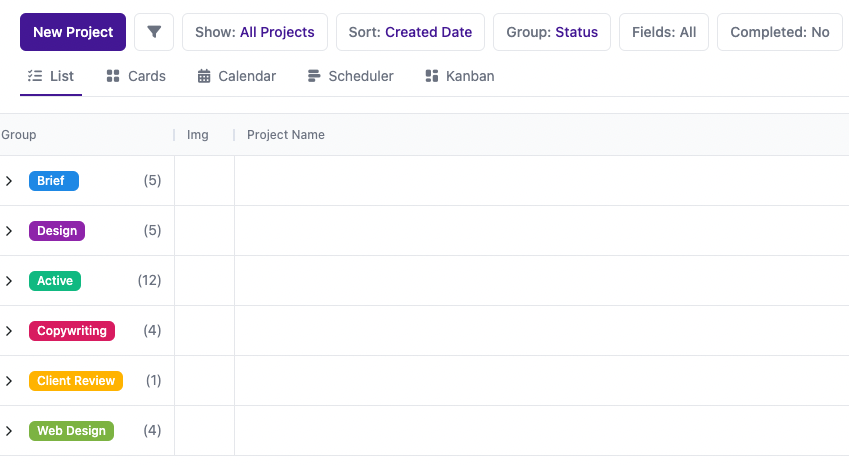
When you choose one of these options, for example "Status" your data will be grouped by this field:
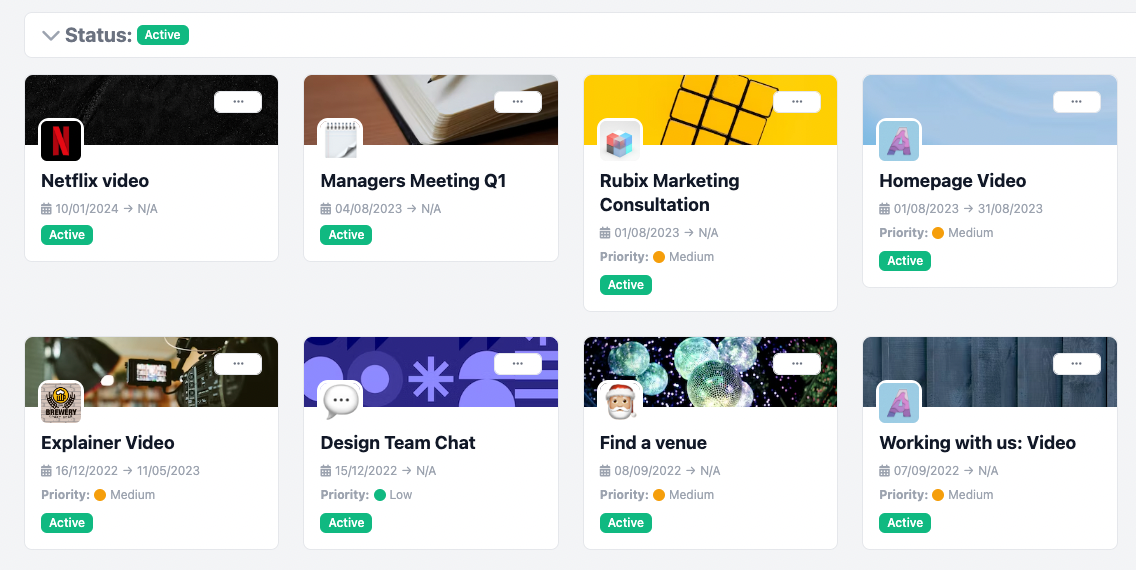
Different views group your data in different ways. For example, cards view shows grouping rows above each section:
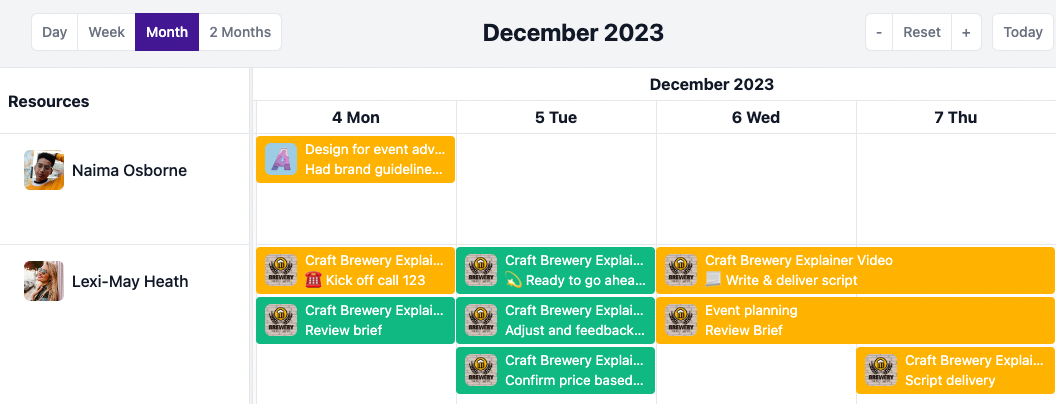
And scheduler view shows the grouped resources at the left hand side:
You can also group by custom field for most views. If you create a custom field then choose to group by it so that you can see items grouped by your custom data points.