When I joined Slite, I started noticing something curious - every day, there'd be a new wireframe, flowchart, or sketch popping up in one Slack channel or another.
Product plans, user flows, system architectures, even meeting notes - my teammates were visualizing everything in their project documentation.
And soon I understood why: visual thinking ensured our team documented complex effects/processes without having a 1-hour-Zoom session to explain it.
That's exactly what modern flowchart software enables. A flowchart app makes clear visual diagrams, helping teams communicate better through flowcharts, mind maps, decision trees, etc.
But with so many options available, finding the right one isn't always straightforward.
That's why I decided to dive deep into testing the best flowchart software options available today.
Here are my findings in a nutshell:
- FigJam - Perfect for those real-time brainstorming sessions, especially if your team's already got the Figma groove going on.
- Excalidraw - Brilliant for quick individual ideation, with that hand-drawn charm and a touch of AI-powered diagram magic.
- MermaidChart - The go-to for developers and technical writers who crave version-control-friendly, code-based diagrams.
- Miro - The enterprise-grade powerhouse, with a comprehensive visual collaboration platform and over 3000 templates to choose from.
- LucidChart - The power user's dream, for complex technical documentation and deep enterprise integrations.
- Draw.io - The free option that's still professional-grade, with offline capability and Atlassian integration.
- BoardMix - A budget-friendly challenger, for diagramming software with AI features and a disruptive one-time lifetime pricing model.
- Moqups - Perfect for UI/UX and product teams who need specialized prototyping and wireframing tools.
Bonus: Slite - The one-stop-shop for teams who want flowcharting and documentation all in one place, with Excalidraw built right in.
How I Tested the Best Flowchart Software
To evaluate the best flowchart software options thoroughly, I created a complex marketing operations flowchart - the kind of challenging diagram that would push any software to its limits.
This test scenario included:
- Multiple interconnected systems
- Decision trees with conditional logic
- Both automated and manual processes
- Various user roles and permissions
- Integration points between platforms
By using the same demanding test case across all tools, I could clearly see each one’s strengths, limitations, and standout features.
I specifically evaluated the following criteria:
Ease of creating complex diagrams
An easy, no-BS team is used and loved by everyone. Moreover, you’d want an intuitive interface that lets you quickly create flowcharts, and move on with your next task.
Available templates and shapes
Starting from a blank page is never fun. Most tools have their own templates for diagrams, flowcharts, etc. This is important because sometimes, you want inspiration and find the best starter visualisation for your task.
Collaboration features
It’s very productive to open a whiteboard flowchart app, invite everyone, and see ideas pop up in real time. That’s why collaboration is so important.
Export and sharing options
For the times you’re flowcharting for documentation, you need wide-supporting export options and simple sharing options to quickly embed/share the link with your team.
Pricing
At the end of the day, it’s a non-essential tool and shouldn’t burn a hole in your company budget.
What is Flowchart Software?
Flowchart software is a specialized computer program designed to help users create visual representations of processes, systems, and workflows.
These tools are invaluable for organizing and managing complex information, making them widely used across various industries such as business, education, and especially in creating engineering documentation.
The helpful visuals are often introduced to other tools such as for recording keeping, to deck software for presentation purposes or into your communication tools for kicking off brainstorming sessions.
With flowchart apps, users can easily map out intricate processes, identify bottlenecks, and streamline operations.
One of the key advantages of flowchart software is its user-friendly interface, often featuring drag-and-drop functionality that simplifies the creation of diagrams.
Additionally, these tools come equipped with customizable templates and shapes, allowing users to tailor their diagrams to specific needs.
Collaboration features are also a staple, enabling teams to work together in real-time, share insights, and make collective decisions.
Whether you’re creating a simple flowchart or a complex network diagram, flowchart software provides the tools needed to visualize and communicate your ideas effectively.
Key Features of Flowchart Software
When selecting flowchart software, it’s crucial to consider several key features that can significantly impact your experience and productivity:
- Ease of Use: A user-friendly interface is essential for quickly creating and editing diagrams. Look for software that offers intuitive navigation and straightforward tools to streamline the diagramming process.
- Customization Options: The ability to customize templates, shapes, and colors is vital for creating diagrams that meet your specific requirements. This flexibility ensures that your diagrams are not only functional but also visually appealing.
- Collaboration Tools: Real-time collaboration features allow multiple users to work on the same diagram simultaneously. This is particularly useful for team projects, as it fosters communication and idea sharing.
- Integration with Other Tools: Seamless integration with other software applications, such as Microsoft Office or Google Docs, enhances workflow efficiency. This feature allows you to embed diagrams into documents, presentations, knowledge base tools, and other platforms effortlessly.
- Scalability: The software should be capable of handling complex diagrams and large amounts of data. This ensures that as your projects grow, the software can accommodate your needs without compromising performance.
- Security: Robust security features are essential to protect your diagrams and data from unauthorized access. Look for software that offers encryption, secure sharing options, and access controls.
Skip The Extra Tools: Document & Draw in Slite
Building flowcharts shouldn't mean juggling multiple apps.
Slite comes with Excalidraw built right in, so you can document processes and sketch diagrams in the same place you keep your team's knowledge.
Write your process docs, draw the flowcharts to explain them, and keep everything organized - all without leaving your knowledge base.
No more copying diagrams between apps or managing separate tools for documentation and visualization.
Need to update that customer journey map? Just open your doc and start drawing.
Want to sketch out a new feature flow during a meeting? The canvas is right there.
Your diagrams stay where they belong: next to the content they explain.
But now, let's dive into this list of flowchart software tools, shall we?
FigJam: The Collaborative Canvas from Figma

| Pros | Cons |
|---|---|
| Real-time collaboration with live cursors | Limited flowchart shapes |
| Built-in timer and voting tools | No automated layouts |
| AI-powered flowchart generation | Basic export options |
| Simple learning curve | Can get messy with large diagrams |
| Large template library |
At Slite, we've found FigJam perfect for quick collaborative sessions. It’s also natively integrated with Slite, so we can easily add the work done into our knowledge base.
The real-time features make remote workshops feel natural, and the simple interface means new team members can jump right in. Emoji reactions keep everyone engaged without switching tools.
One standout feature is the AI-powered flowchart generator. Simply type in your process description, and FigJam's AI will create a starting flowchart for you.
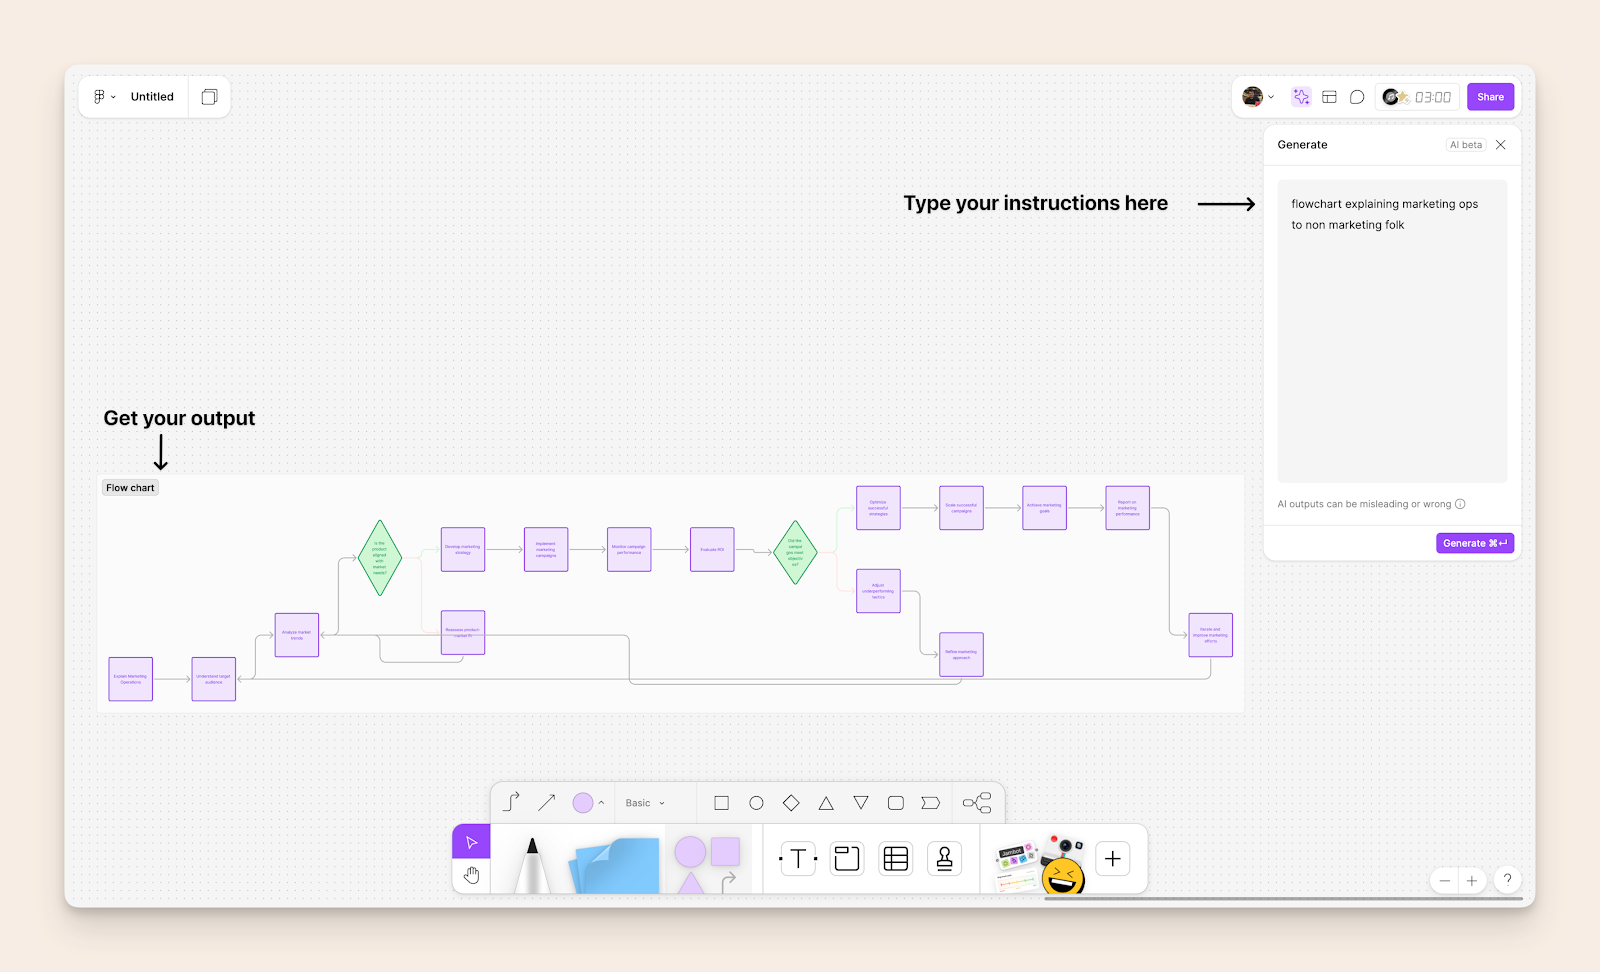
The Figma app in ChatGPT can now recommend and create AI-generated FigJam diagrams based on your conversation, including text-based flow charts, sequence diagrams, state diagrams, and Gantt charts.
The built-in timer and voting tools have transformed our brainstorming sessions. Teams can focus on ideation while FigJam handles the workshop mechanics. For teams already using Figma, it's an obvious choice - files move seamlessly between both tools.
However, FigJam isn't built for complex flowcharts.
When our diagrams grow beyond basic workflows, we start to feel the limitations of its shape library and layout options. The canvas can get cluttered quickly without careful organization.
Pricing
| Plan | Price |
|---|---|
| Starter Team | Free for 3 collaborative files, unlimited personal drafts |
| Professional | $5/user/month (billed annually) |
| Organization | $5/user/month (billed annually) |
| Enterprise | $5/user/month (billed annually) with the option of a custom quote |
Note: Viewers are always free, and students/educators can access Professional features for free.
Excalidraw: Minimalist Diagramming with AI Power

| Pros | Cons |
|---|---|
| Simple, hand-drawn aesthetic | Basic collaboration features in the free plan |
| Powerful AI text-to-diagram feature for creating flowcharts | Limited styling options for creating flow charts |
| AI-powered flowchart generation | No complex shape libraries |
| Mermaid chart integration | Simple animation options |
| Open-source | |
| Local-first approach | |
| Lightweight and fast |
Excalidraw is a flowchart software that excels in personal ideation and quick diagram creation.
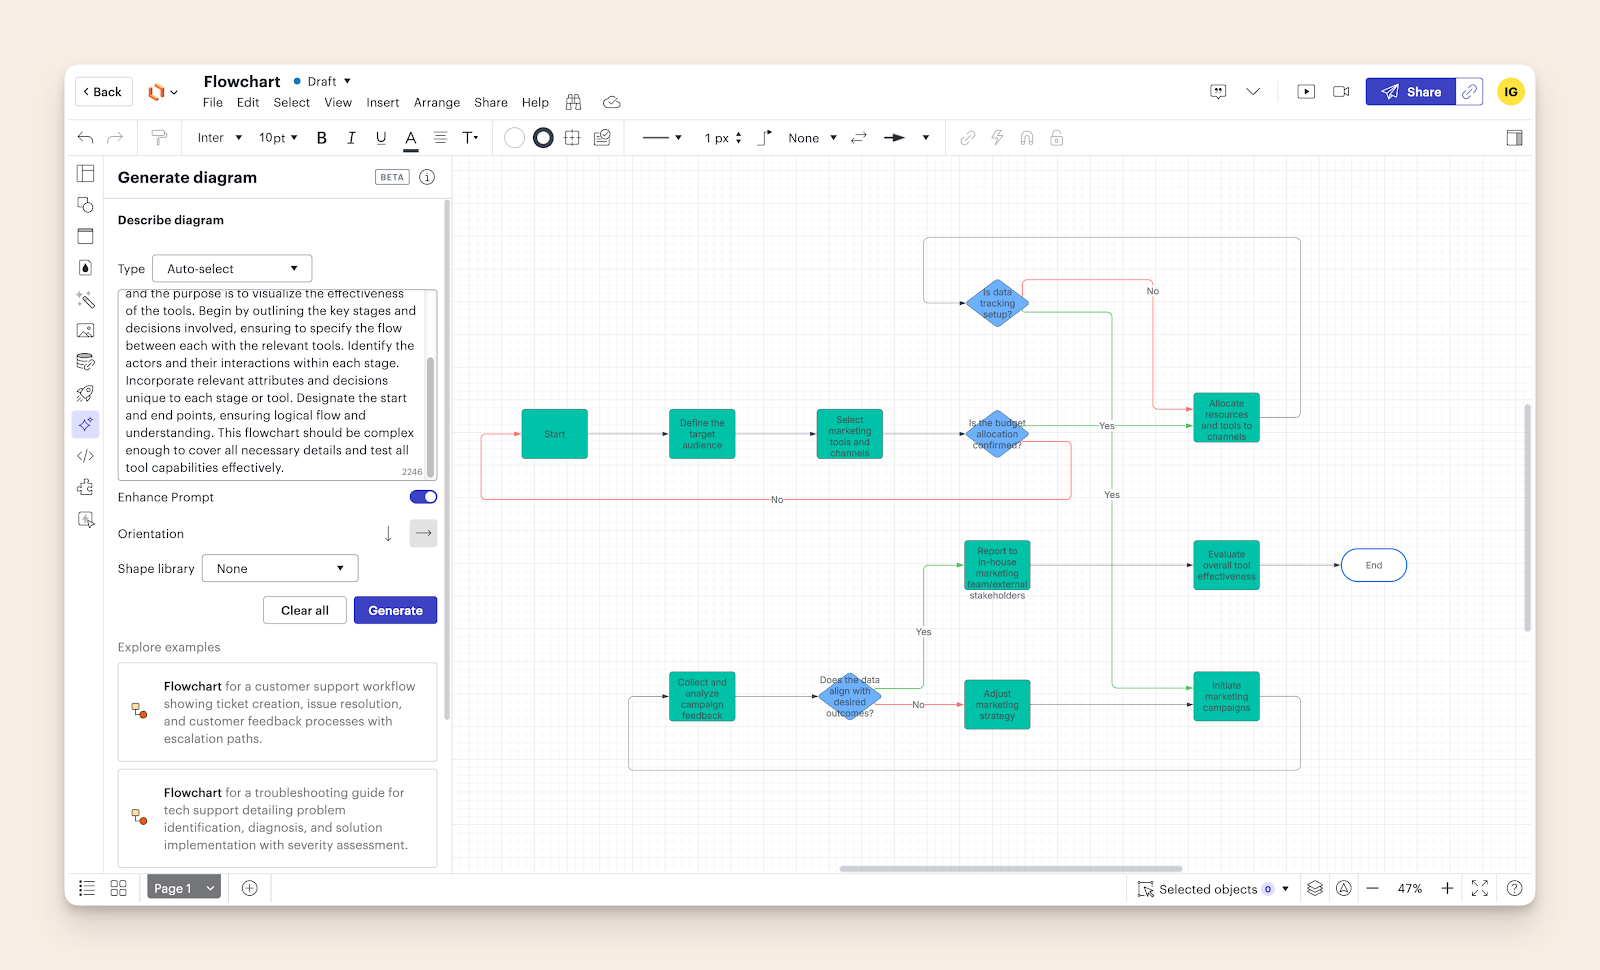
When I tested its new AI text-to-diagram feature with the prompt:
“create a complex marketing operations flowchart scenario that will help test each tool’s capabilities effectively,”
this is what I got:
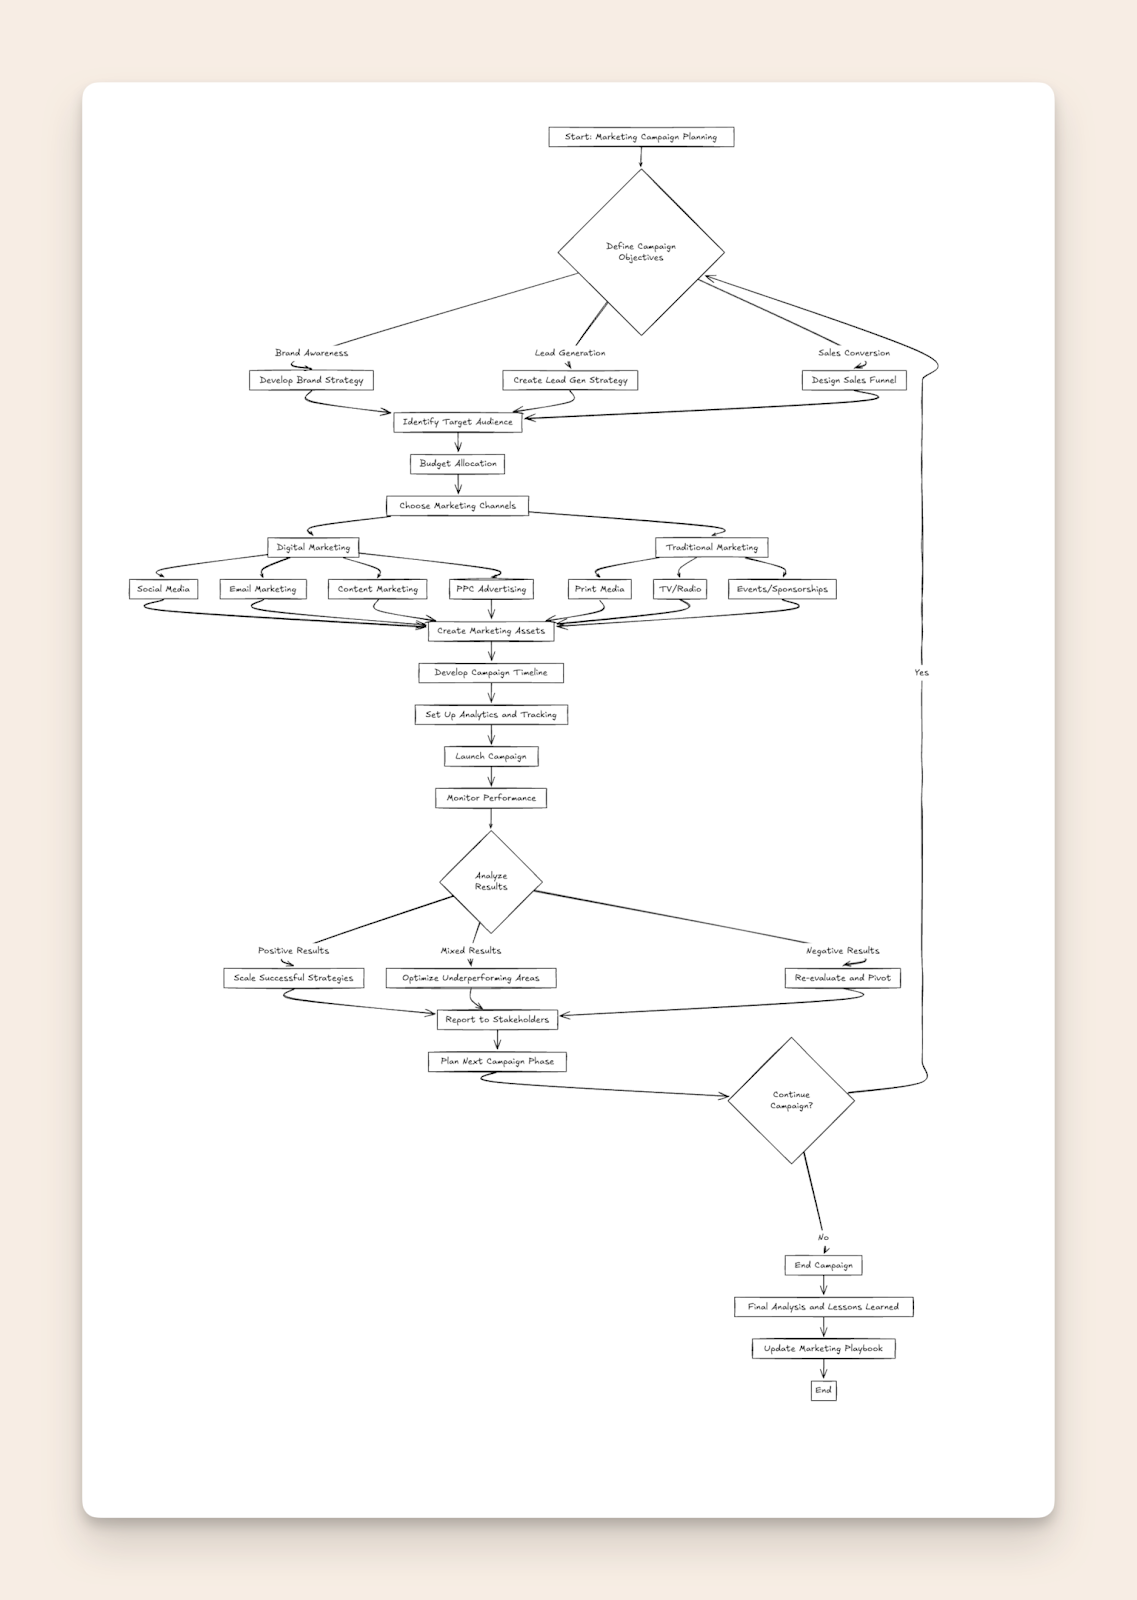
Excalidraw’s AI generated the comprehensive flowchart covering everything from campaign objectives and marketing channels to performance analysis and stakeholder reporting, demonstrating its impressive ability to understand and visualize complex business processes.
The tool’s integration with Mermaid syntax makes it particularly appealing for developers and technical users who want to maintain their diagrams in code.
That’s why we decided to create a custom integration of Excalidraw with Slite, making it your one-stop solution for brainstorming and visualizing ideas within the editor.
While it lacks the rich collaboration features of FigJam, its strength lies in rapid individual ideation and documentation. The hand-drawn aesthetic gives diagrams a unique, approachable feel.
Pricing
| Plan | Price |
|---|---|
| Free Solo | Full editor functions, unlimited collaborators, 1 infinite scene, local storage |
| Plus | $6/user/month (billed annually) |
Note: 14-day free trial available for Plus plan, with 14% savings on annual billing
→ Want to make sure your flowcharts are not lost in information silos? Keep all of your product discovery, research and specs in one place.
Mermaid: Text-Based Diagramming with Universal Compatibility

| Pros | Cons |
|---|---|
| Text-based diagramming (version control friendly) | Learning curve for syntax |
| Platform independent i.e. no vendor lock-in | Limited styling options |
| AI-friendly code generation | No freehand drawing |
| Git integration | Basic real-time collaboration |
| Future-proof format | |
| Markdown-like syntax | |
| Wide ecosystem support |
Mermaid provides a polished interface for creating and managing Mermaid diagrams.
When I tested its text-to-diagram feature with the prompt
"create a complex marketing operations flowchart scenario that will help test each tool's capabilities effectively,"
the AI generated detailed Mermaid code that perfectly rendered the complex marketing workflow - demonstrating how powerful the combination of AI and Mermaid syntax can be.
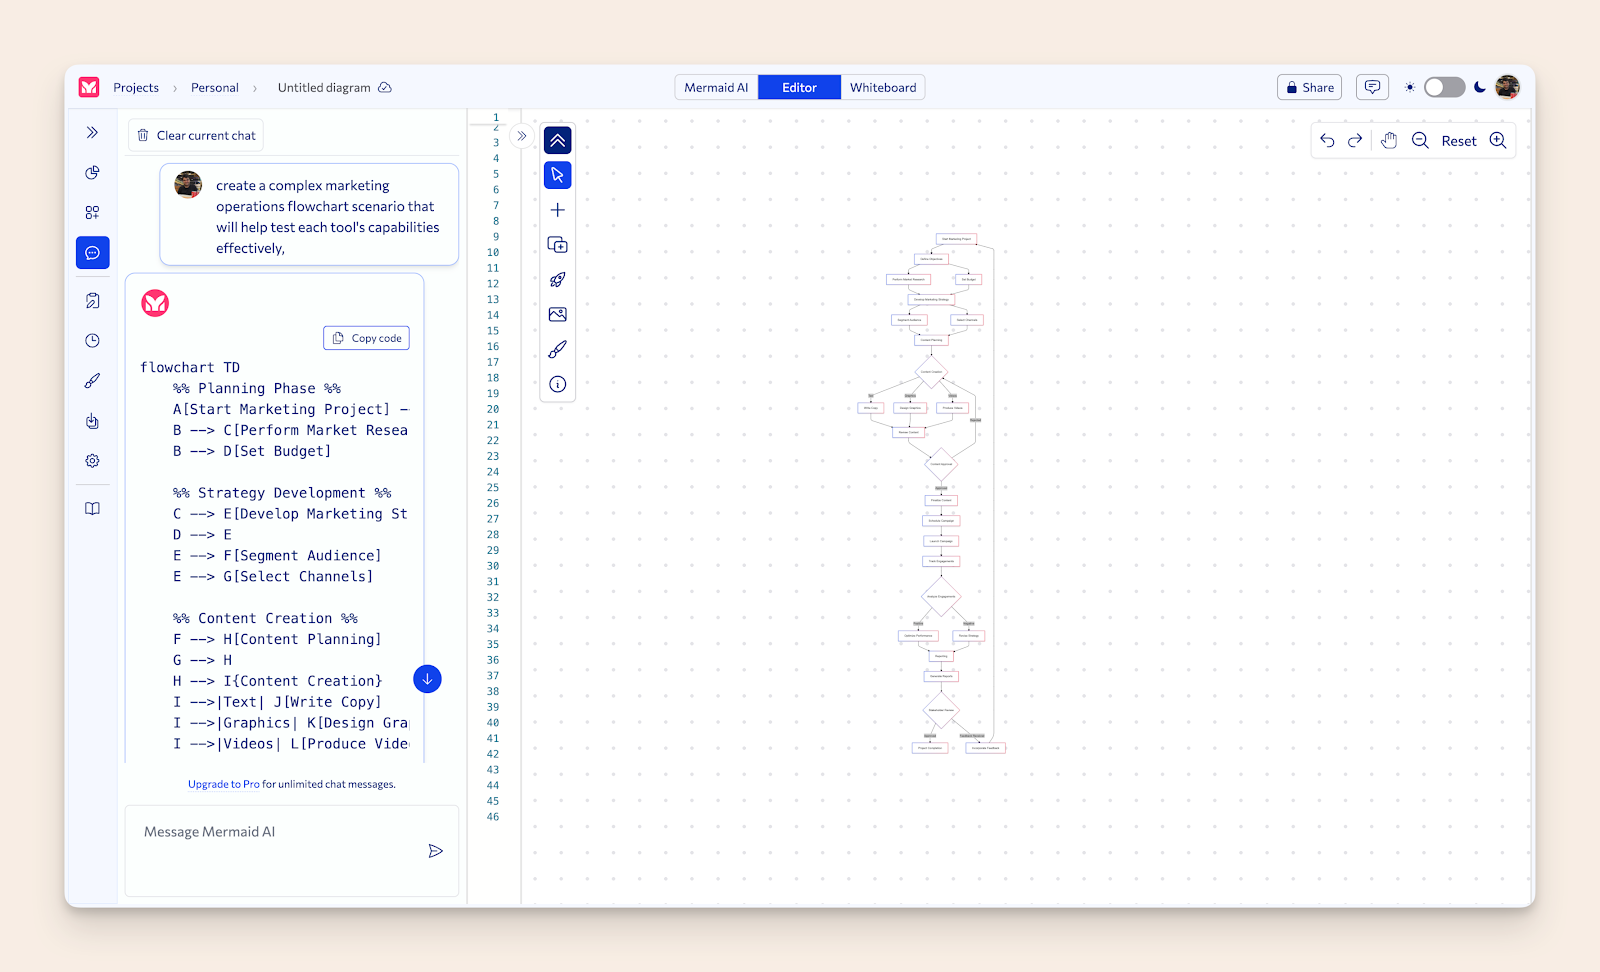
What sets Mermaid apart is its universal compatibility - your diagrams exist as code that can be used anywhere that supports Mermaid rendering, from GitHub and Notion to Excalidraw and documentation platforms.
This makes it an excellent choice for developers, technical writers, and teams who value portability and version control for their diagrams.
The Mermaid integration enhances your Slite workspace by incorporating powerful diagramming capabilities into your docs.
I personally create flowcharts for SEO articles using Claude Sonnet 4.6 and Mermaid.
Whenever I have to explain a complex workflow, I simply prompt Claude to:
"Generate mermaid code for a flowchart comprehensively explaining [Insert process name]".
When Claude gives me the code, I can copy it to any Mermaid editor and get my flowchart immediately.
Pricing
| Plan | Price |
|---|---|
| Basic | Free |
| Plus | $10 per user / month (annually) |
| Premium | $20 per user / month (annually) |
| Enterprise | Custom pricing |
Note: Free trial available for paid plans.
Miro: Enterprise-Grade Visual Collaboration Platform

| Pros | Cons |
|---|---|
| Massive template library (3000+ templates) | Can be overwhelming for simple needs |
| Comprehensive feature set including Gantt | Higher learning curve |
| Enterprise-grade security and sharing | More expensive than alternatives |
| AI Canvas with intelligent widgets | Interface can feel cluttered |
| Miro's MCP server connects boards to AI coding tools like Cursor, GitHub Copilot, and Claude Code. | Performance can lag with large boards |
| 100+ app integrations | Some features locked behind higher tiers |
| Advanced collaboration tools | |
| Live cursor tracking | |
| Interactive widgets (voting, estimation, etc.) | |
| Robust presentation capabilities |
When I tested its capabilities with our marketing operations flowchart scenario, Miro's AI not only generated the diagram but also automatically added interactive elements like voting widgets, estimation tools, and sprint planning blocks - showcasing how it transcends basic diagramming to become a complete visual collaboration platform.
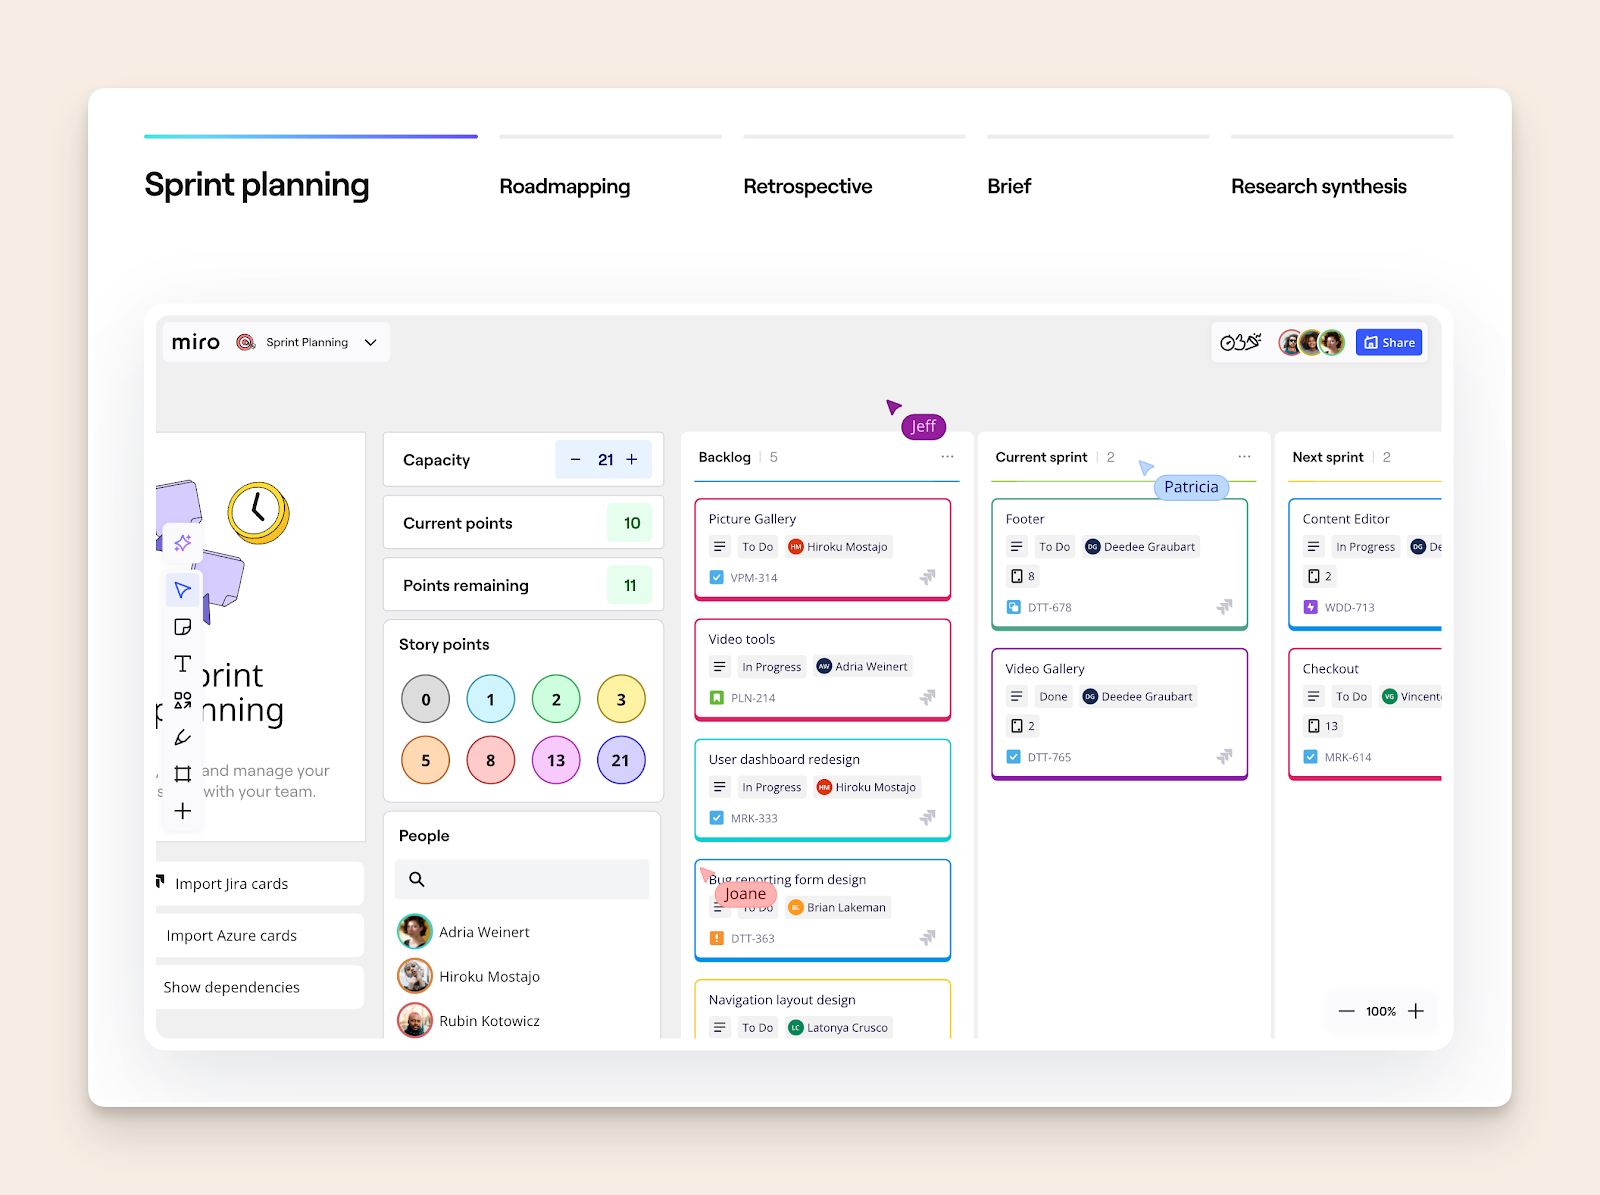
Since 2025 they have implemented new AI Canvas, where teams and AI work side-by-side, featuring Sidekicks (conversational AI agents) and Flows (multi-step AI workflows).
What sets Miro apart is its comprehensive approach to visual collaboration.
While other tools focus on specific use cases, Miro provides an all-in-one solution with features like board management, presentation mode, and the game-changing AI Canvas that transforms static diagrams into interactive workflows for product management, sprint planning, and team collaboration.
With newly introduced Miro Prototypes that allow users to generate screens from sticky notes, flows, or prompts using AI, Miro is entering Moqups' territory and is worth a note.You can seamlessly integrate Miro with your existing Slite docs, as well, so your Miro boards automatically update, keeping you and your team in sync with the latest ideas and project visualizations.
Pricing
| Plan | Price |
|---|---|
| Free | $0 |
| Started | $8 / mo per member |
| Business | $20 /mo per member |
| Enterprise | Custom price — from 30 members |
LucidChart: The Power User's Diagramming Platform

| Pros | Cons |
|---|---|
| Professional-grade feature set and templates | Complex interface with steep learning curve |
| Deep enterprise integrations (Microsoft 365, Jira, etc.). LucidChart's compatibility with Microsoft 365 makes it a strong alternative to Microsoft Visio, especially for users who need seamless integration within the Microsoft ecosystem. | Higher pricing than competitors |
| Advanced data linking capabilities | Overwhelming for casual users |
| Process Agent experience module with a new interface in the chat panel, including guided questions to gain context for optimal output. |
When I tested the marketing operations flowchart scenario, LucidChart's professional-grade capabilities shone through - offering precise control over every aspect of the diagram, from advanced data linking to custom shape libraries.
However, achieving the desired result required significantly more time to navigate its extensive feature set.
They even have an AI generation feature like Figjam or Miro, but only better. Voice-to-text prompting has been a recent addition that allows users to transcribes voice into the prompt section.
Think of LucidChart as the Microsoft Excel of diagramming tools - immensely powerful and flexible, but requiring dedicated time to master.
It's particularly strong in technical documentation, process mapping, and enterprise scenarios where precision and integration capabilities matter more than quick, casual diagramming.
In November 2025 Lucid launched an MCP server that allows diagram creation directly from LLM prompts, connecting to ChatGPT, Claude, Microsoft Copilot, GitHub Copilot, and Cursor.
By connecting Lucidchart with Slite, you can bring your visual documentation into your team's workspace.
Pricing
| Plan | Price |
|---|---|
| Free | $0 |
| Individual | $9 / user |
| Team | $10 / user |
| Enterprise | Contact sales |
Note: VAT excluded
Draw.io: The Focused Online Diagramming Tool

| Pros | Cons |
|---|---|
| Perfect feature balance - not too complex, not too basic | Limited collaboration features |
| Extensive shape libraries focused on technical diagrams, making it one of the best free flowchart software options available. Diagrams.net (formerly Draw.io) is particularly noted for its versatility, range of diagram types, and cloud storage capabilities. | No presentation mode |
| Flexible deployment (offline, cloud, or Atlassian integration) |
When I tested the marketing operations flowchart scenario, Draw.io's straightforward approach made it quick to create professional diagrams without the complexity of enterprise tools.
Its strength lies in being a focused diagramming tool rather than trying to be everything for everyone.
Draw.io stands out by doing one thing well - pure diagramming. While other tools try to be complete collaboration platforms, Draw.io maintains its focus on creating clear, professional diagrams with minimal friction.
It's particularly strong for technical documentation, system architecture, and process flows. You’ll find its native integration with Slite quite useful for keeping your product specs in one place.
For teams already using Atlassian products, the draw.io app is migrating to be fully Forge-only for Confluence Cloud, enforcing security to promote data residency and isolation with no external data egress. The ability to embed diagrams directly into documentation and keep them updated in real-time creates a streamlined workflow that other standalone tools can't match.
A standout feature is its offline-first approach - you can work entirely offline and sync later, making it ideal for situations where internet connectivity is unreliable or when working with sensitive information that needs to stay local.
Pricing
They differentiate between Cloud and Data Centar user tiers. Below are the prices for the Cloud tier:
| Plan | Price |
|---|---|
| Standard | Free |
| Advanced | $37 per month (for a team of 10) |
Note: Price excluding VAT.
BoardMix: The Rising Free Diagramming Software Challenger

| Pros | Cons |
|---|---|
| Intuitive interface with gentle learning curve | Limited community templates |
| AI-powered diagramming and whiteboarding features: BoardMix stands out as an online diagramming tool, offering real-time collaboration, ease of use with templates, and seamless integration with other productivity applications. | Basic collaboration features |
| Competitive lifetime deal offering | Newer platform with developing ecosystem |
BoardMix differentiates itself through an aggressive pricing strategy and AI integration. Its interface strikes a balance between functionality and simplicity, making it particularly appealing for teams looking for an affordable, long-term solution.
The platform's lifetime deal at $99 is notably disruptive in a market dominated by subscription models. While it may lack some advanced features of established competitors, its core functionality is solid for most diagramming and whiteboarding needs.
One caveat that has been reported is that AI credits do not renew monthly, which limits one of the most promising features of the platform.
Pricing
| Plan | Price |
|---|---|
| Free | $0 |
| Starter | $5 |
| Business | $8 |
| Enterprise | Custom pricing |
Moqups: The Prototyping Specialist

| Pros | Cons |
|---|---|
| Specialized UI/UX design focus | Higher price point |
| Comprehensive prototyping tools available as both web and desktop apps | Learning curve for non-designers |
| Strong collaboration features | Limited general diagramming tools |
Moqups excels as a dedicated prototyping platform, setting itself apart from general diagramming tools. Its focus on UI/UX workflows makes it particularly valuable for design teams and product development. Though, it's perfectly good for making flowcharts as well:
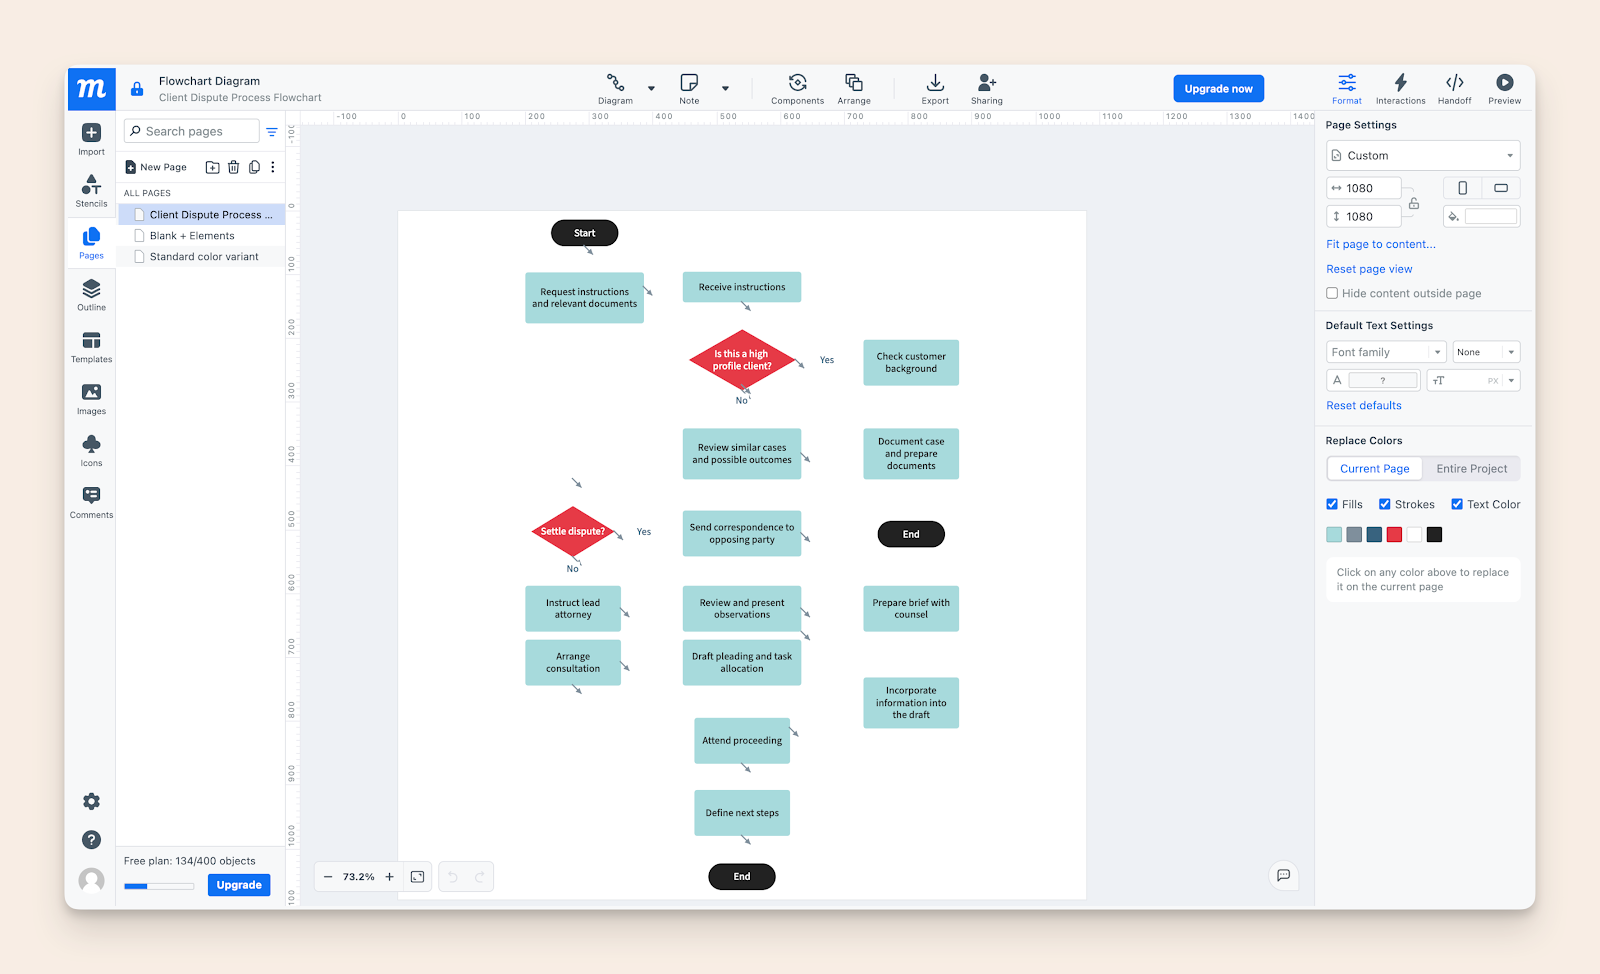
The platform's integrated approach to wireframing and prototyping provides a seamless experience for design-focused teams, though the pricing structure may be steep for small teams or individual users.
The platform's integrated approach to wireframing and prototyping provides a seamless experience for design-focused teams, though the pricing structure may be steep for small teams or individual users.
Pricing
| Plan | Pricing |
|---|---|
| Free | $0 |
| Standard | $11 per month, billed monthly |
| Business | $24 per month, billed monthly |
| Unlimited | $139 per month, billed monthly |
Choosing the Right Flowchart Software
With a plethora of flowchart software options available, selecting the right one can be daunting. Here are some tips to help you make an informed decision:
- Identify Your Needs: Start by determining what you need the software for. Are you creating simple flowcharts, complex network diagrams, or organizational charts? Understanding your requirements will help narrow down your options.
- Research Options: Explore different software options and compare their features and pricing. Look for tools that offer the functionalities you need at a price point that fits your budget.
- Read Reviews: User reviews can provide valuable insights into the software’s strengths and weaknesses. Pay attention to feedback on ease of use, reliability, and customer support.
- Try Before You Buy: Many flowchart software providers offer free trials or demos. Take advantage of these to test the software’s capabilities and see if it meets your needs.
- Consider Scalability: Choose software that can grow with your needs. Ensure it can handle complex diagrams and large datasets as your projects become more sophisticated.
Decision Framework for Picking Your Tool
Choosing the right diagramming tool starts with understanding your daily work patterns.
Your team's typical tasks and workflows should guide your choice more than fancy features or current trends. What matters most is how the tool fits into your existing processes and makes work easier, not harder.
Team dynamics play a crucial role in tool selection success.
Consider your team's:
- technical skills,
- their willingness to learn new systems,
- and how they collaborate.
A complex tool with powerful features might actually slow down a team that needs quick, simple solutions.
Budget constraints need careful thought, but they shouldn't be your only guide.
Look at the total cost of using the tool, including training time, potential integration needs, and scaling costs. Sometimes, a higher upfront cost saves money in the long run through better productivity and fewer workarounds.
Making Your Final Choice
Your final decision should reflect your team's real needs, not just what looks good in a demo. Start with a clear list of must-have features and nice-to-haves.
This helps cut through marketing noise and focus on tools that truly match your requirements.
Testing matters more than feature lists. Use free trials to work on actual projects, not just sample tasks. Get feedback from team members who'll use the tool daily. Their experience matters more than management preferences.
Remember that no tool is perfect, but the right one makes your work flow better. Focus on finding a tool that removes friction from your current process rather than forcing you to change how you work.
The best choice is often the one that feels natural to use and becomes almost invisible in your daily workflow.

