There's no shortage of knowledge base statistics on the internet. Most of them quote the same five analyst reports, written years apart, framed around market sizing, survey-based AI adoption, and high-level productivity numbers. Almost none of them answer the harder question, which is what a working knowledge base actually looks like once a team is inside it.
We had the data to answer the harder question. So we ran it.
Every stat in here comes from inside real production knowledge bases, not from a survey of opinions about them.
For the opinion side, our company brain statistics show what teams believe versus what they've actually built.
The numbers tell one story, and we're going to follow it carefully because it changes what a knowledge base is for. Doc creation is going down in real workspaces. AI and search usage are going up.
That single crossover, visible across the dataset, is the reason we wanted to share our findings and contribute to mapping out where knowledge management is heading next.
By the end you'll be able to answer: who actually writes in a knowledge base, how big these systems get, how people navigate them, what AI is doing to creation behavior, why teams churn, and where the category goes from here.
If you want to go deeper after this read, the related research on cross-tool search behavior and content aging is linked at the bottom.
Key takeaways
- In any given month, fewer than 1 in 20 docs in an active knowledge base gets updated.
- The top 1% of contributors create 47% of all knowledge base content.
- 76% of registered users never create a single doc.
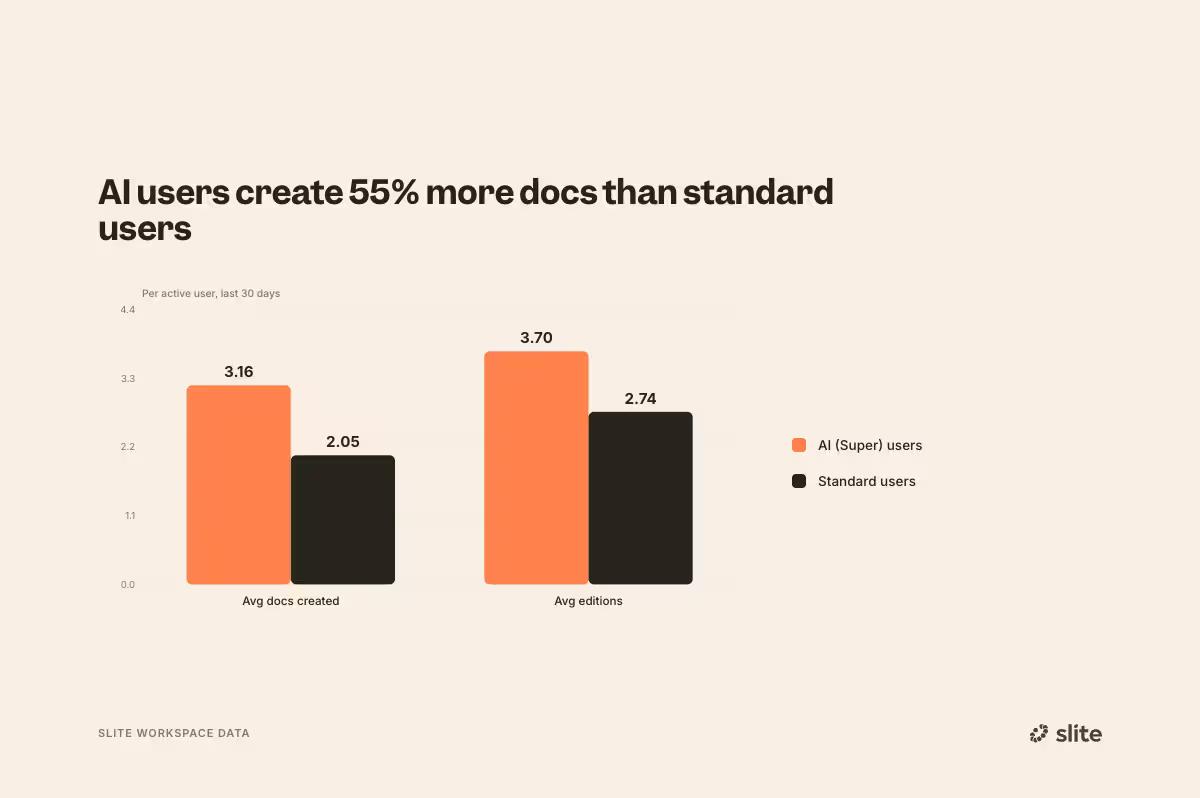
- Users with AI access create 55% more docs per month than users without it.
- Workspaces that use AI heavily hold 4x more docs than light AI users.
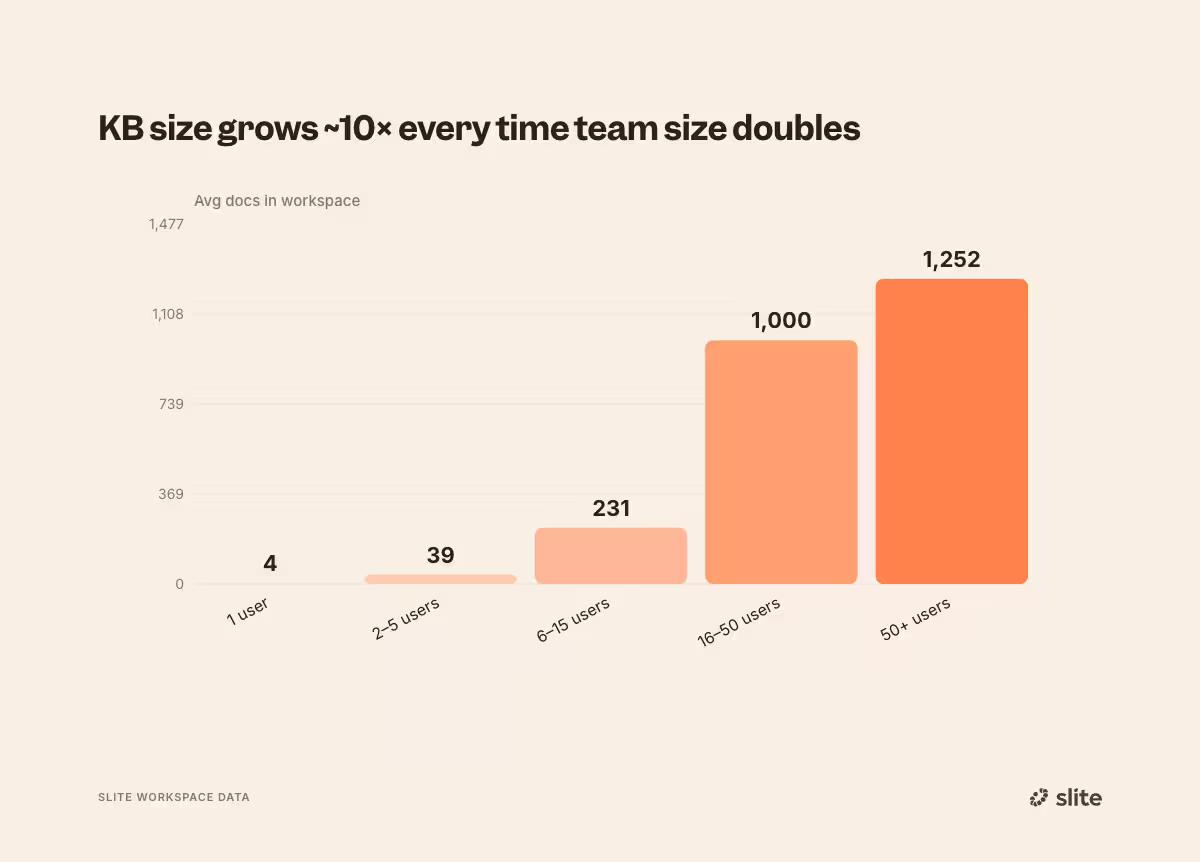
- Every doubling of team size grows the knowledge base roughly 10x.
- The single biggest reason teams cancel a KB subscription is "not used enough." Cost is a distant second.
Methodology
Every number in this article comes from anonymized, aggregated Slite workspace telemetry. The window is May 2024 through May 2026.
We aggregated at the workspace level. No individual users or workspaces are named.
This edition was built end-to-end inside Slite using our own BigQuery integration: data extracted, charts generated, and the analysis written up in the same workspace.
Who actually writes in a knowledge base?
Knowledge bases are not crowd-sourced. They are run by a tiny power-user minority, and that minority is concentrated in product and leadership roles.
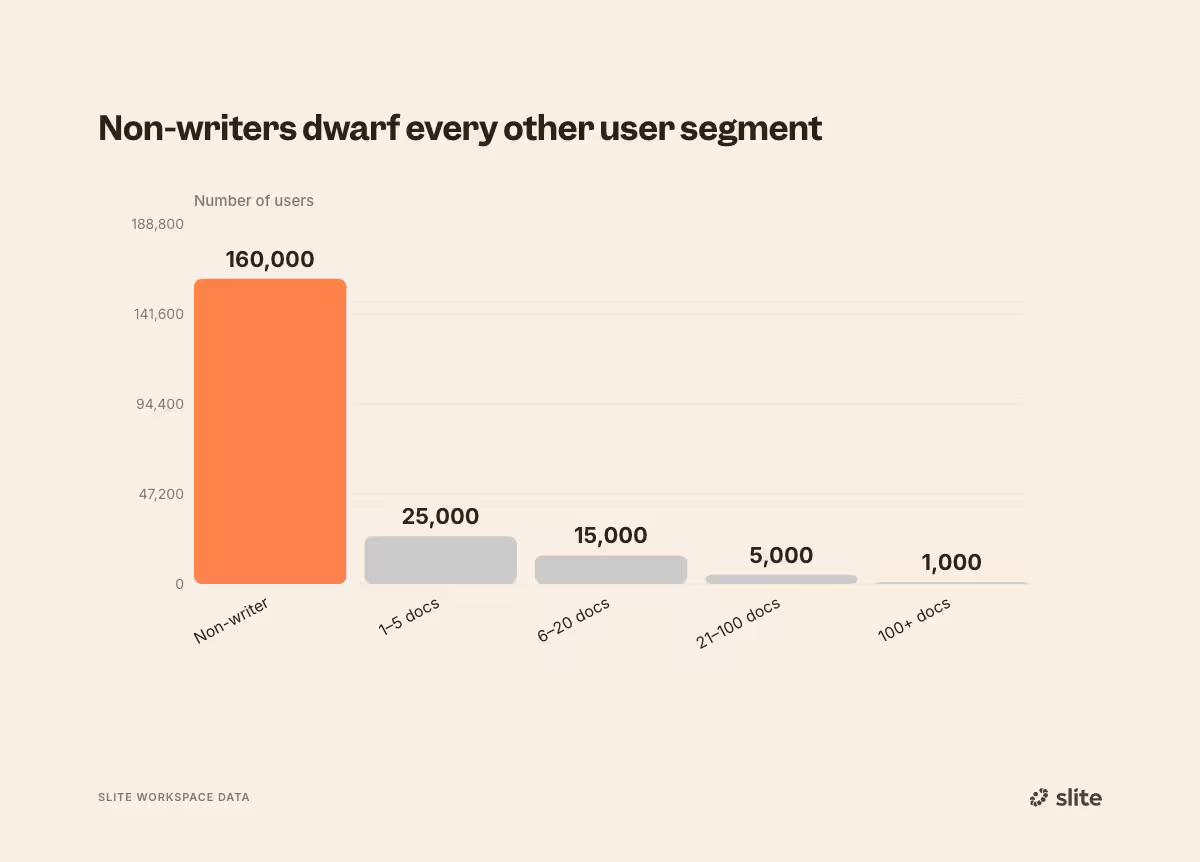
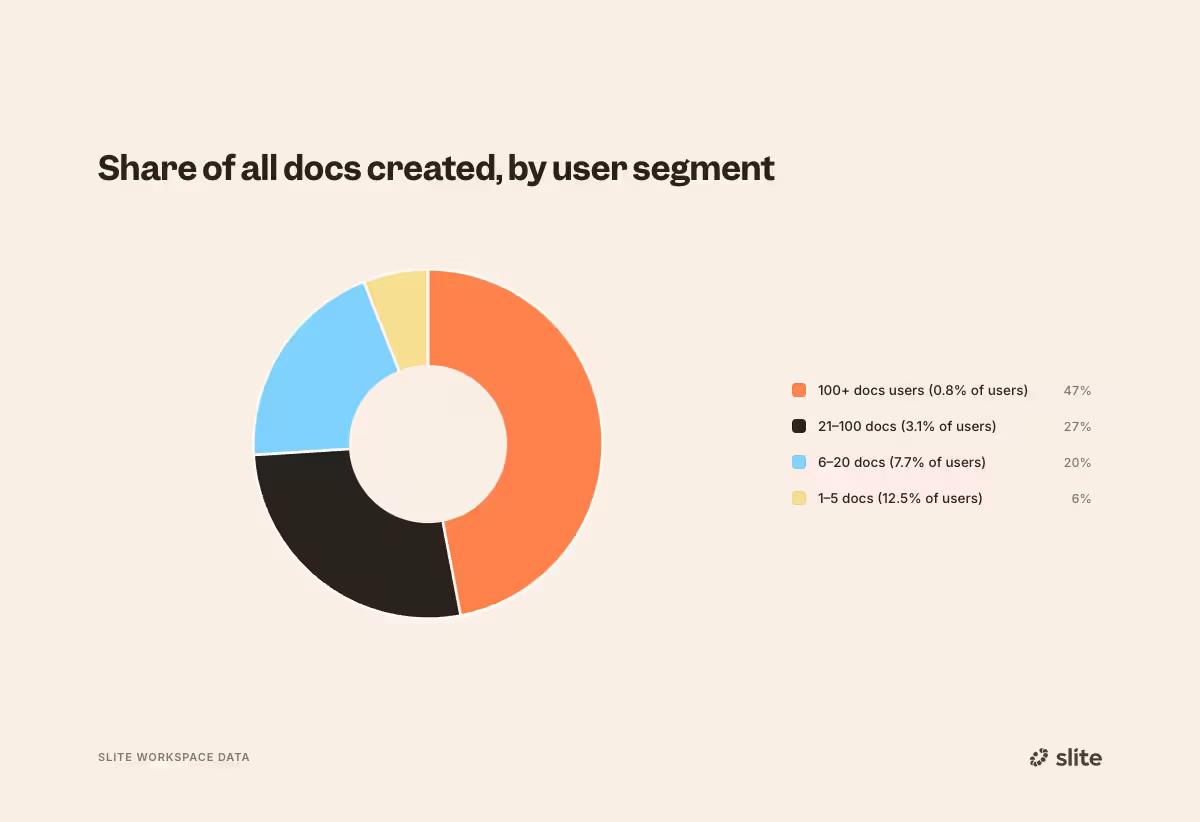
The top 1% of contributors create 47% of all content. The flat majority writes nothing at all.
Here's how the contributor pyramid breaks down:
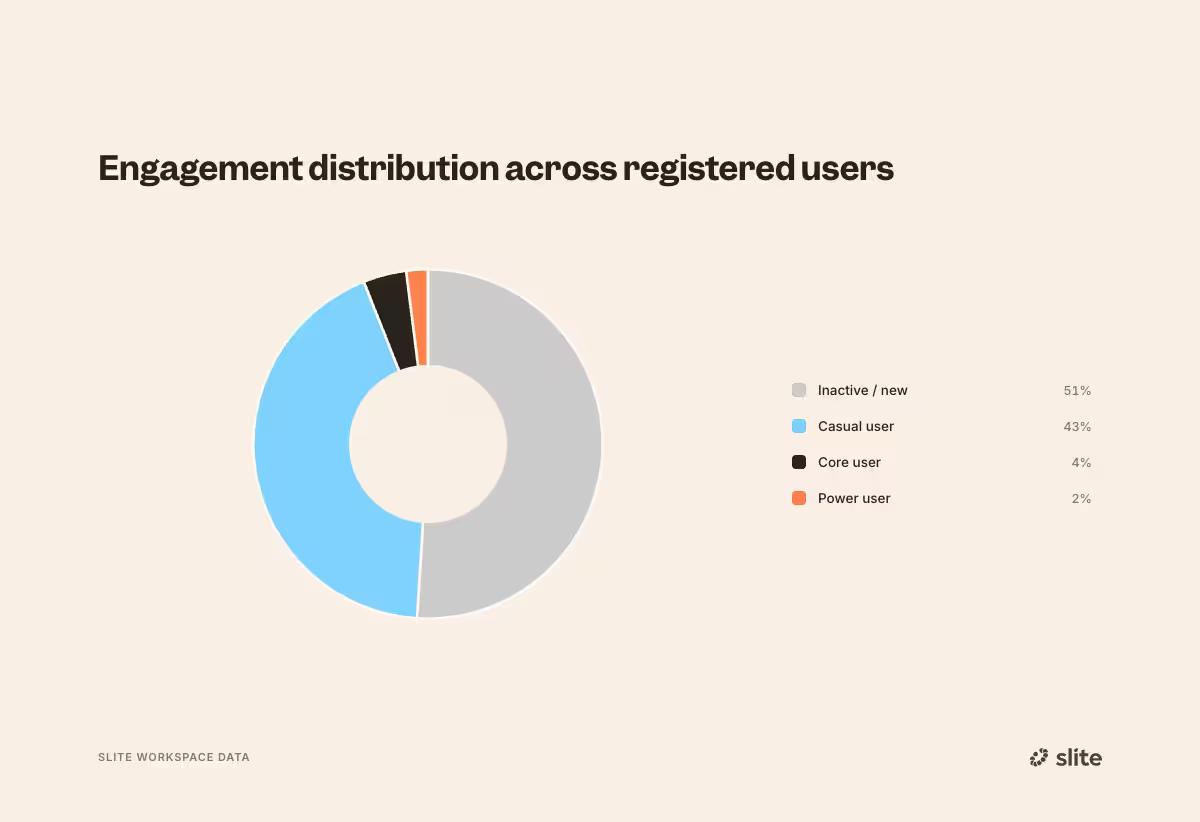
The engagement view shows the same shape from a different angle.
Of all registered users:
- 51% are inactive (most likely passive readers or one-time visitors),
- 43% are casual,
- 4% are core,
- and 2% are power users.
Only 6% of users are genuinely engaged with the knowledge base in the active-writer sense.
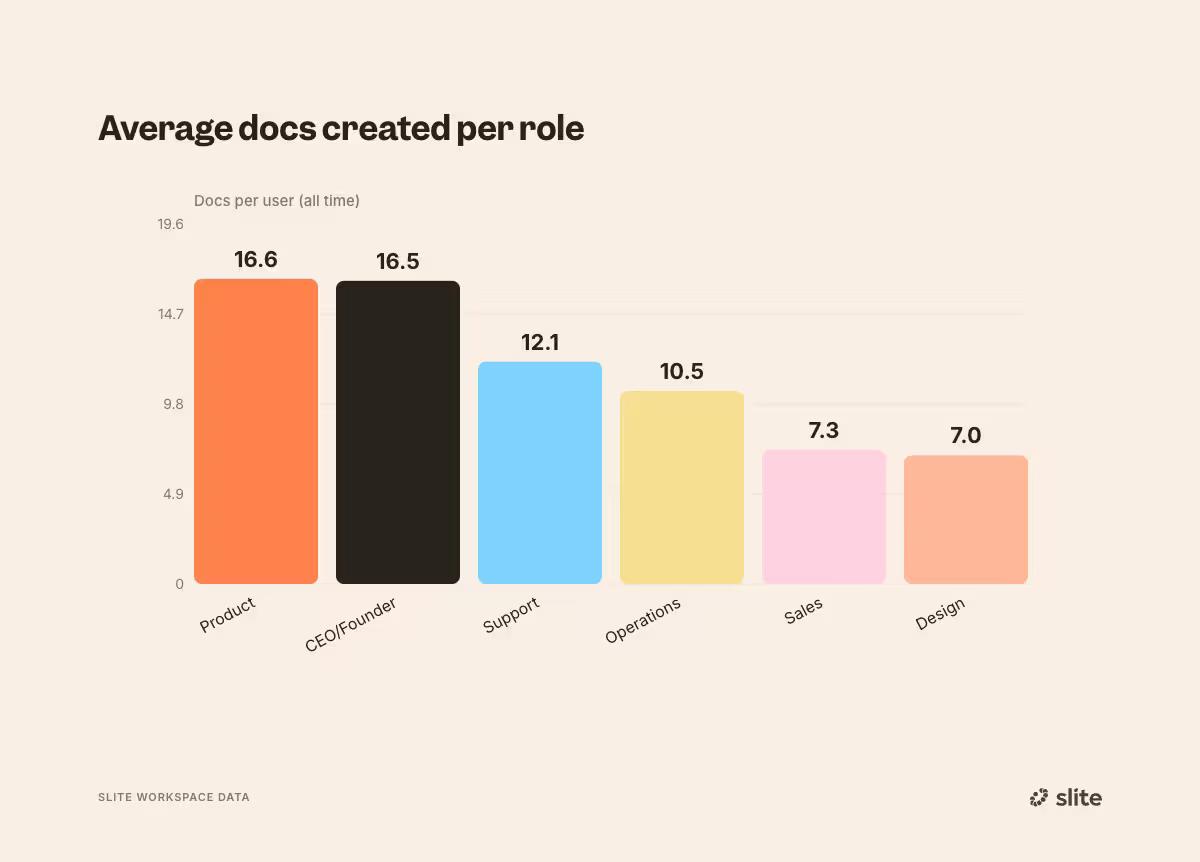
When we cut by role, the writing minority has a clear profile:
- Product (16.6 docs created on average) and CEO/Founder (16.5) lead.
- Support (12.1) and Operations (10.5) follow.
- Sales (7.3) and Design (7.0) sit at the bottom.
Product and leadership roles create roughly twice as much knowledge base content as sales or design teams.
Which means the "everyone in the company contributes to the knowledge base" pitch has never matched reality, in any KB, ever. The system runs on a handful of writers, usually the people who feel most responsible for institutional clarity and reducing tribal knowledge.
They are the ones with skin in the game on whether the team can answer its own questions a week from now. Everyone else is reading, querying, and occasionally commenting.
If writing is this concentrated, the next question is what that concentrated writing actually produces at scale.
How big do knowledge bases get?
Knowledge base content doesn't scale linearly with team or time. It compounds.
The team-size data makes this concrete.
- A solo workspace has 4 docs on average.
- A 2-to-5-person team has 39 docs.
- Six to fifteen people, 231 docs.
- Fifty or more, 1,252 docs.
Roughly: every time a team doubles in size, the knowledge base grows ten times over.
KB age compounds the same way.
Workspaces that survive past two years average 37 docs, about double newer workspaces.
The 3-to-6-month bucket runs slightly higher than the 6-to-12-month one, which is a selection effect: teams that create a lot of docs early are also the ones that stick around.
What looks at first like healthy growth is also the setup for the maintenance bill that comes due in a later section of this article. Every successful knowledge base grows into a maintenance problem.
The same compounding that makes a mature KB valuable to query against also makes it impossible to keep current by hand.
If KBs compound into large archives, how are the people inside them actually navigating?
How do people use the knowledge base?
Knowledge bases are mostly consumed, not authored. And the dominant way in is already search, not browsing.
Inside the all users who were active in April and May 2026, the split looks like this:
- 52% performed at least one editing action that month. 48% were pure readers.
- 61% used search in any given month. Search is the most common navigation method after direct doc access.
- 27% of all comments came from read-only users.
- 21% shared content in a given month.
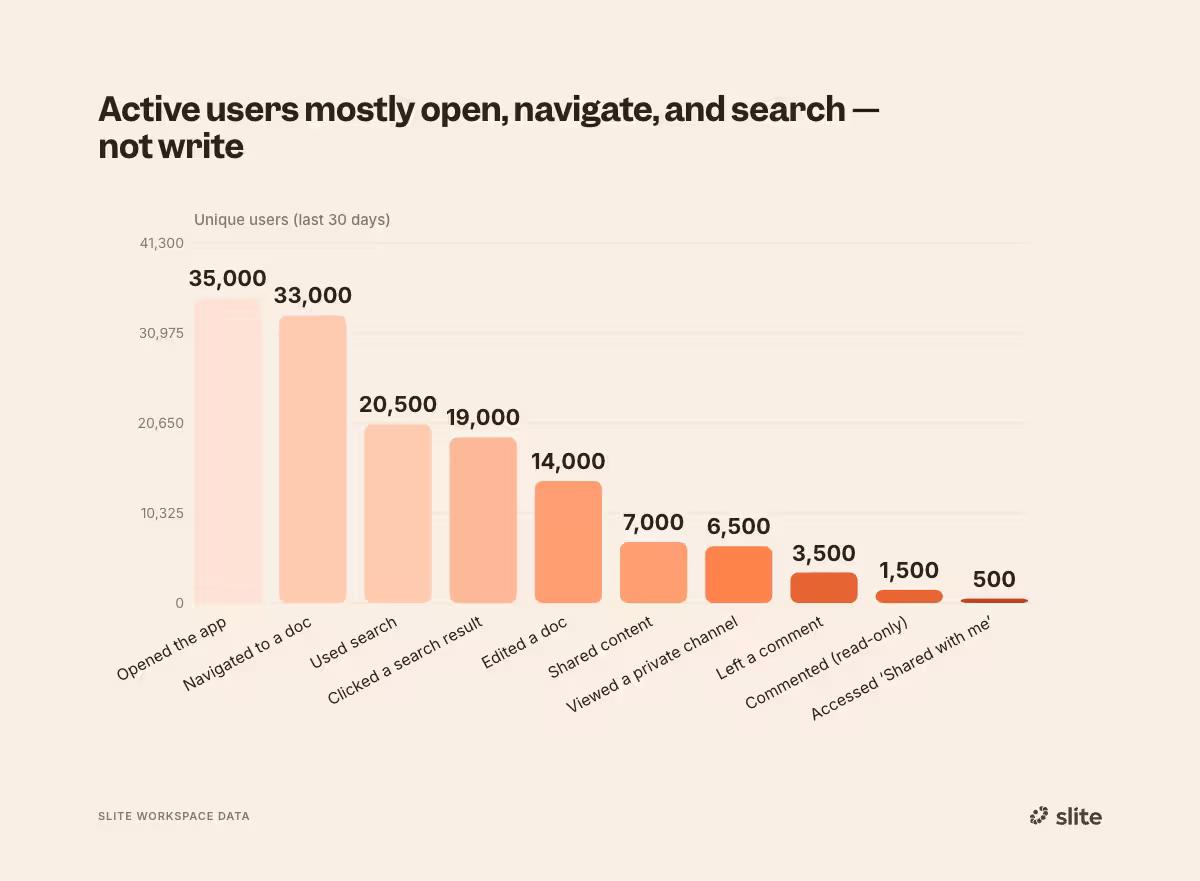
What this means is straightforward. The modal interaction with a knowledge base is "I have a question, I want an answer." That is a retrieval problem, not an authoring problem.
Whoever wins retrieval owns the next decade of knowledge base software.
The reason search and AI assistants matter so much in this category is that they match what the median user already does in a KB on any given day. Read, search, occasionally ask, occasionally comment, rarely write.
So what happens when retrieval gets dramatically better?
What is AI doing to creation behavior?
AI doesn't replace doc creation for the people who already write. It amplifies them. The same shift quietly lets the casual majority skip documentation entirely.
Among active users, those with a seat on Slite Agent, our AI assistant for knowledge bases, create 3.16 docs per month versus 2.05 for other users.
That's 55% more docs and 35% more editions per month for AI-using individuals.
Zoom out to the workspace level and the correlation gets sharper.
Workspaces in the 51-to-200 queries-per-month band hold roughly 4x the docs of workspaces in the 1-to-10 band.
The heaviest AI users, the workspaces in the 200+ queries-per-month band, sit on the largest KBs and the largest active rosters by a wide margin.
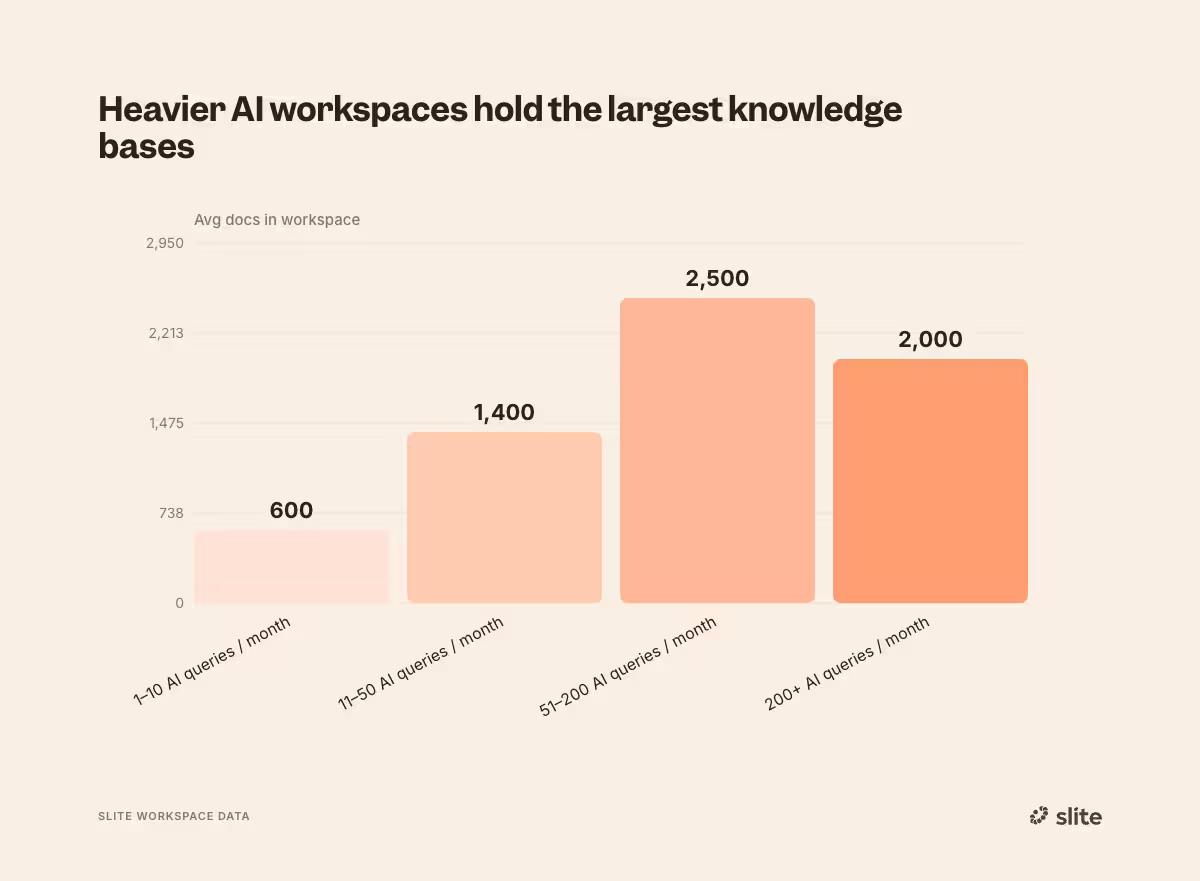
Both of these are correlations, not causes.
Slite Agent users may self-select as more engaged to begin with. Larger, more mature KBs may also attract heavier AI usage because there's more to retrieve.
So why does anyone write docs in the first place?
People write docs primarily because they don't want to pay the cost of re-finding an answer. Documentation is a hedge against re-search. When AI and search return reliable answers, the hedge stops paying off for the casual user. They stop writing.
And because modern AI search reaches into Slack, project trackers, support tickets, calendars, and the rest of the team's tooling, the team's information can persist and resurface without anyone having to formalize it into a doc first. The casual user can lean on retrieval rather than deposit.
The knowledge is still there, it just isn't sitting in a wiki page anymore.
The power user keeps writing, because they are the one formalizing outputs other people will consume. That's why the AI-user creation stat goes up, not down. Selection effect on engagement, reinforced by AI tooling.
The net effect across the population goes the other way. Doc creation declines, but the docs that do get created are higher signal.
We can see the same falloff in our own workspace data at Slite as adoption of our AI features picks up: the momentum on new doc creation softens at exactly the point where queries start replacing them.
In January 2024 we have launched internally AI search and the doc creation has dropped dramatically since.
Here’s a screenshot of our Usage analytics that reflects it:
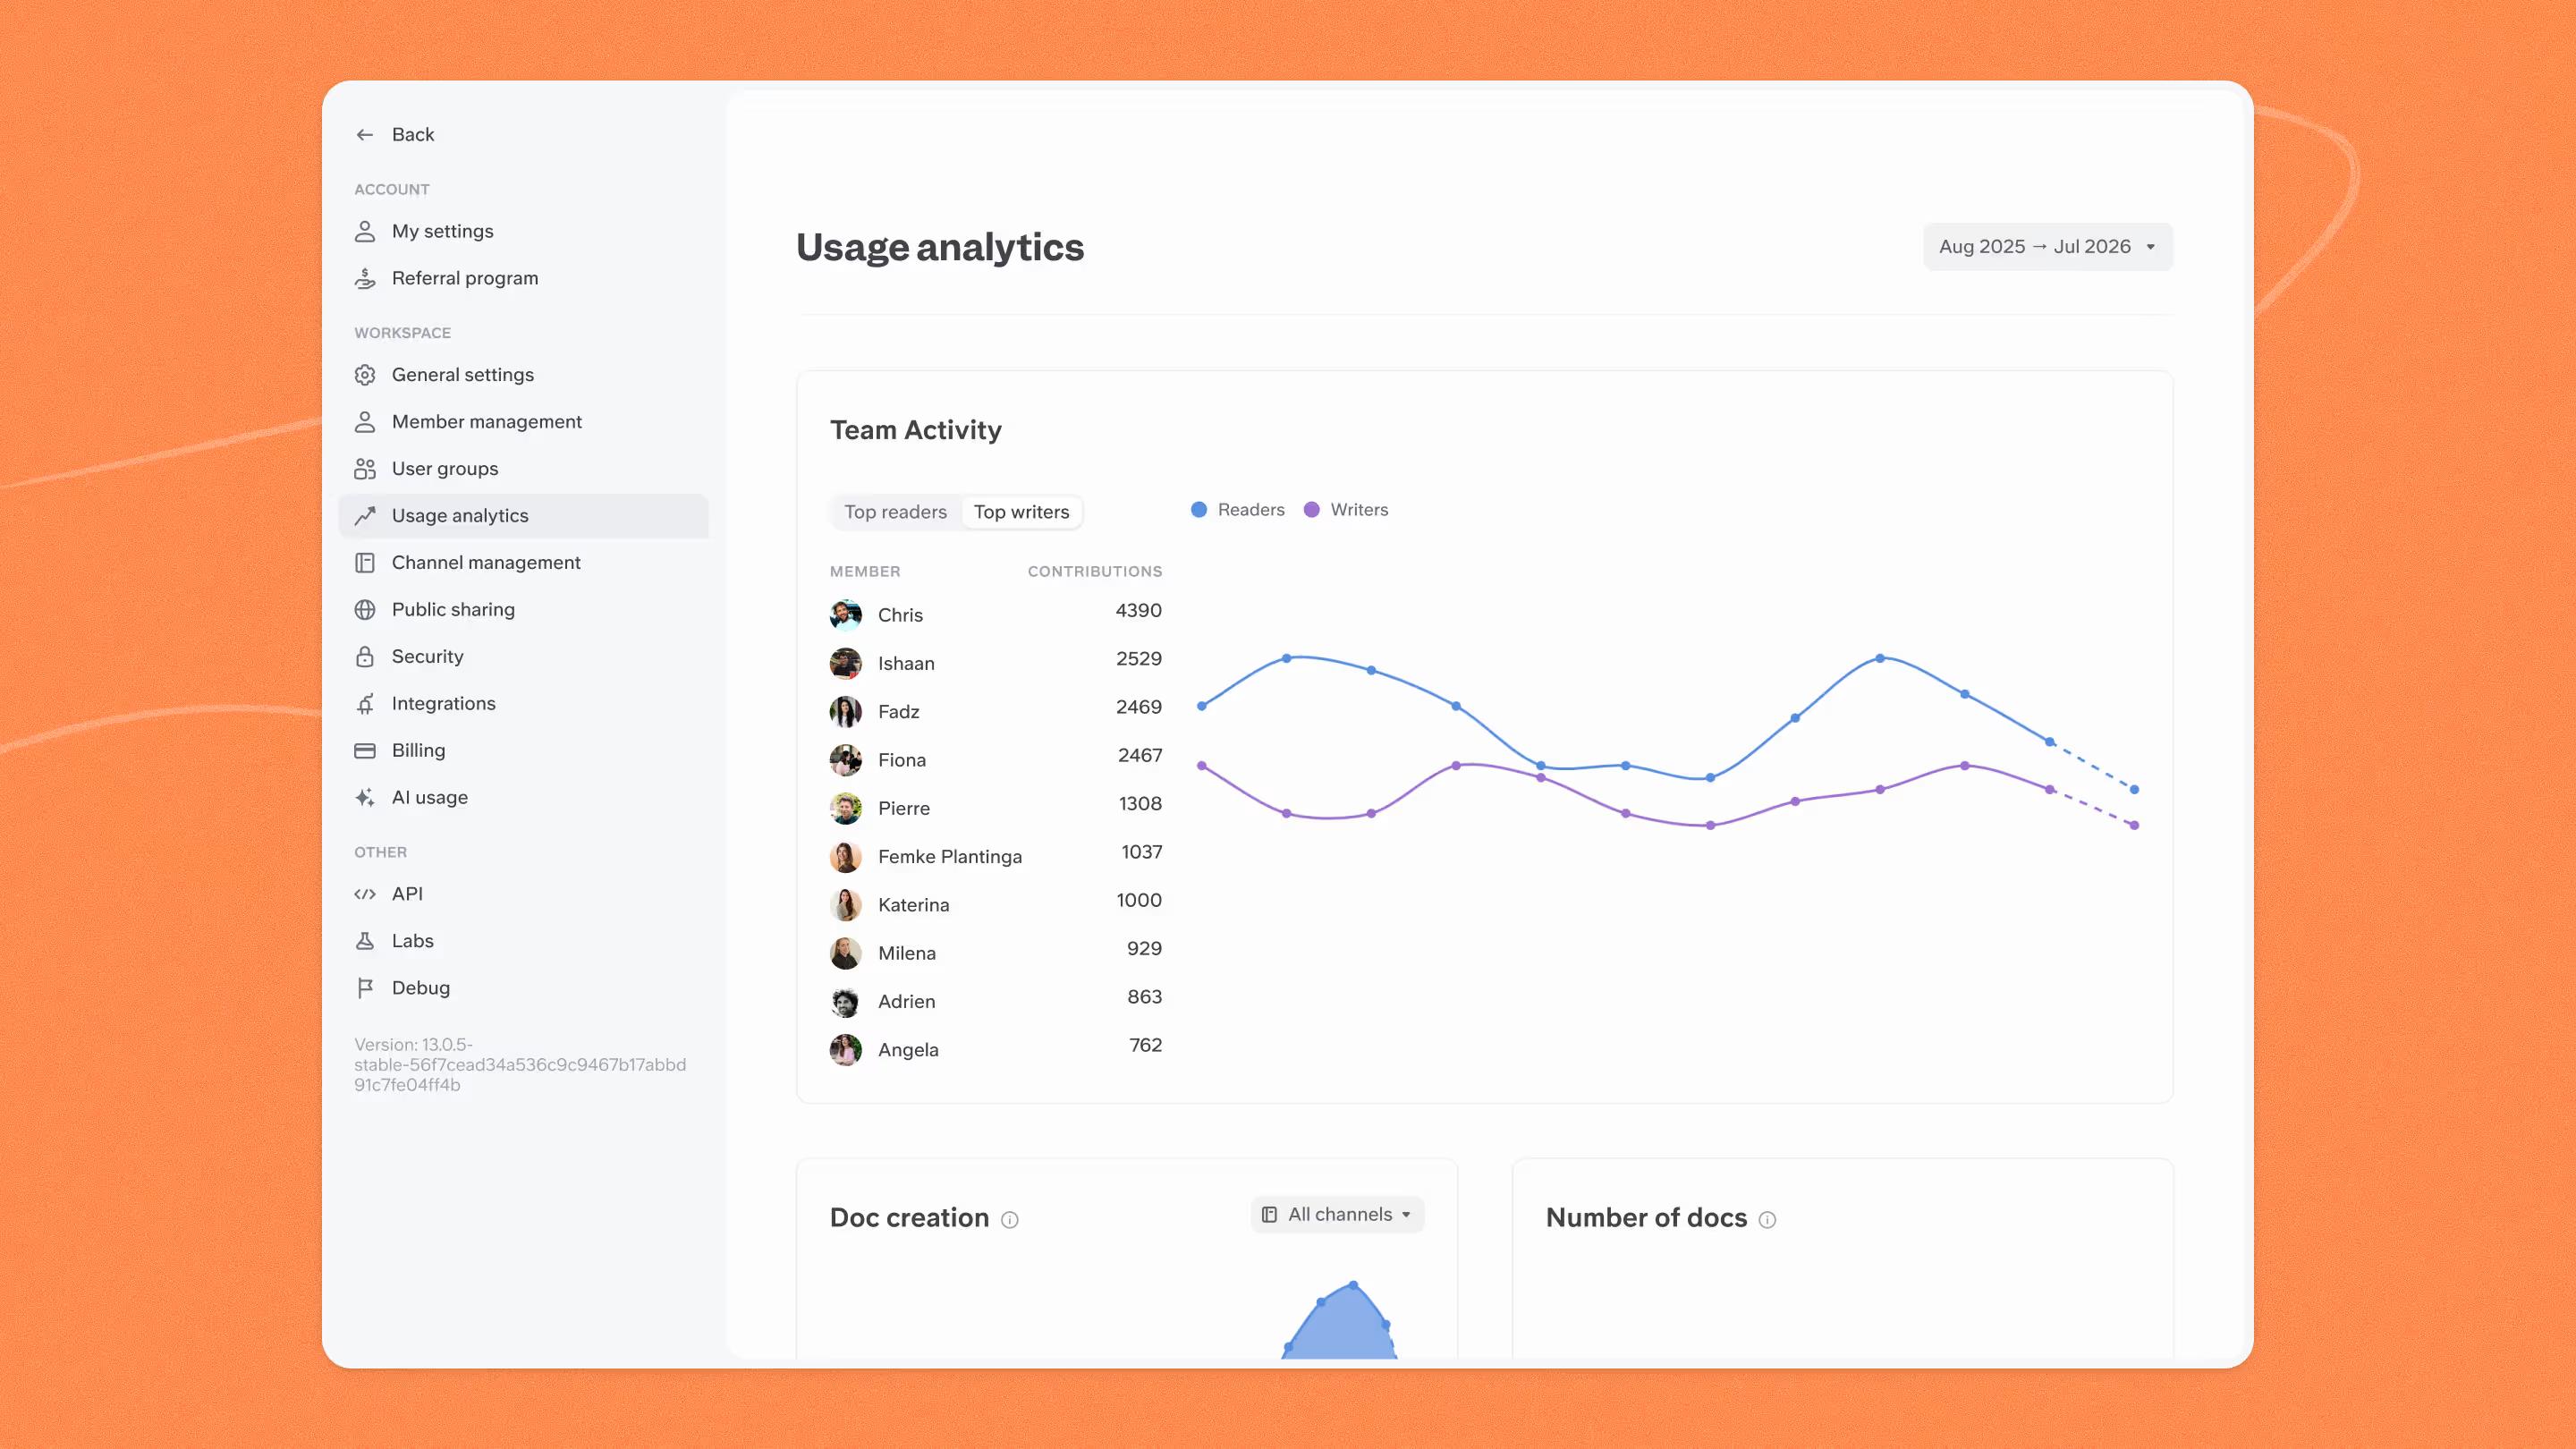
The reason for the falloff is that AI (Slite Agent) is filtering the entire corpus of our internal data.
On the surface, this data can read as the death of the knowledge base. The numbers tell a different story.
AI is changing what a knowledge base is for. The shift is from a place where everyone deposits, to a place where a few people curate, AI extends, and everyone else queries.
If writing is increasingly a job for the few, what is everyone else (and the system itself) doing about the maintenance?
Where does the maintenance bill come due?
Knowledge bases are mostly static. Teams churn for a reason that has nothing to do with the product breaking, and the market is already shopping for a system that does the maintenance for them.
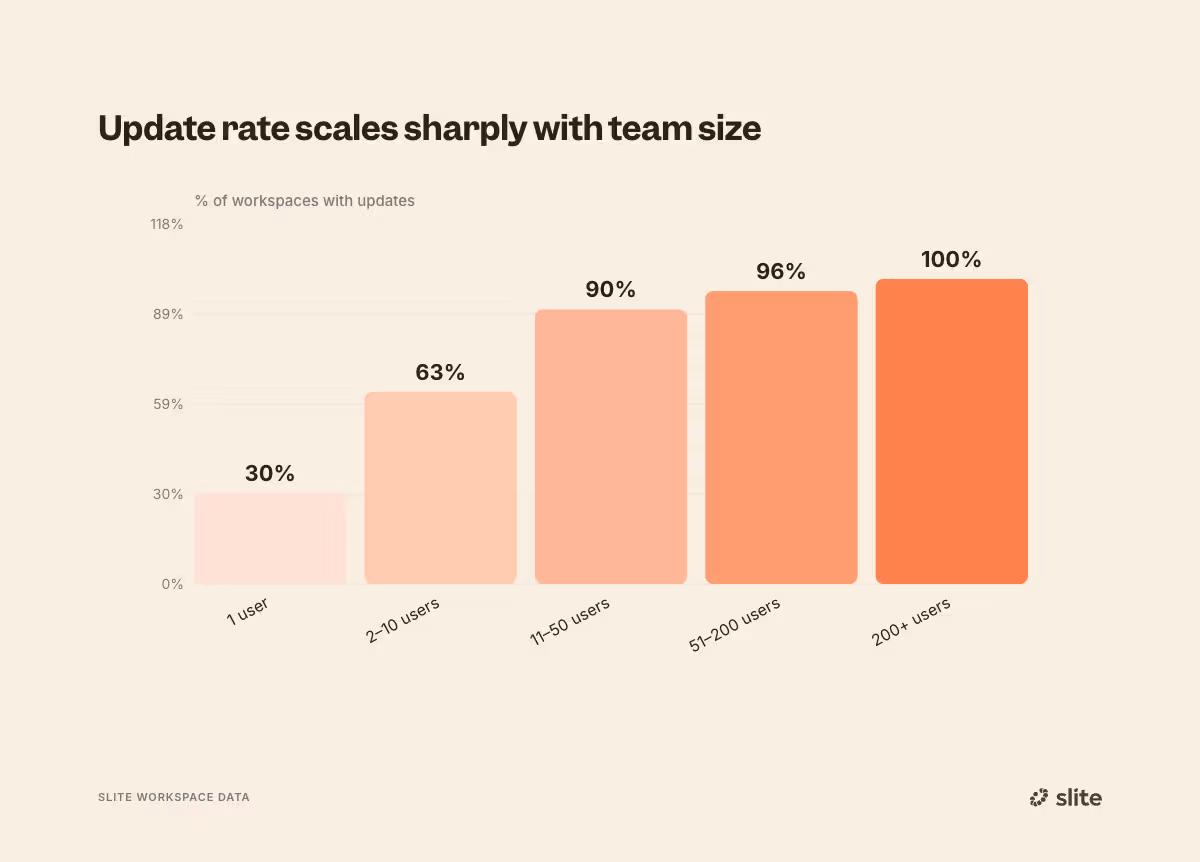
The doc update rate is the clearest signal we found.
Across active workspaces, roughly 900,000 live docs logged about 48,000 edit events in the last 30 days.
That works out to about 5.4 edit events per 100 docs per month, and because the underlying field counts events rather than unique docs, the true share of docs actually touched is likely lower.
Either way, over 94% of active KB content sits untouched in any given month.
The churn pattern lines up with that picture.
The reason teams most often cite when they downgrade a KB subscription is "not used enough." Cost sits well behind it as the next most common reason.
The dominant failure mode is adoption.
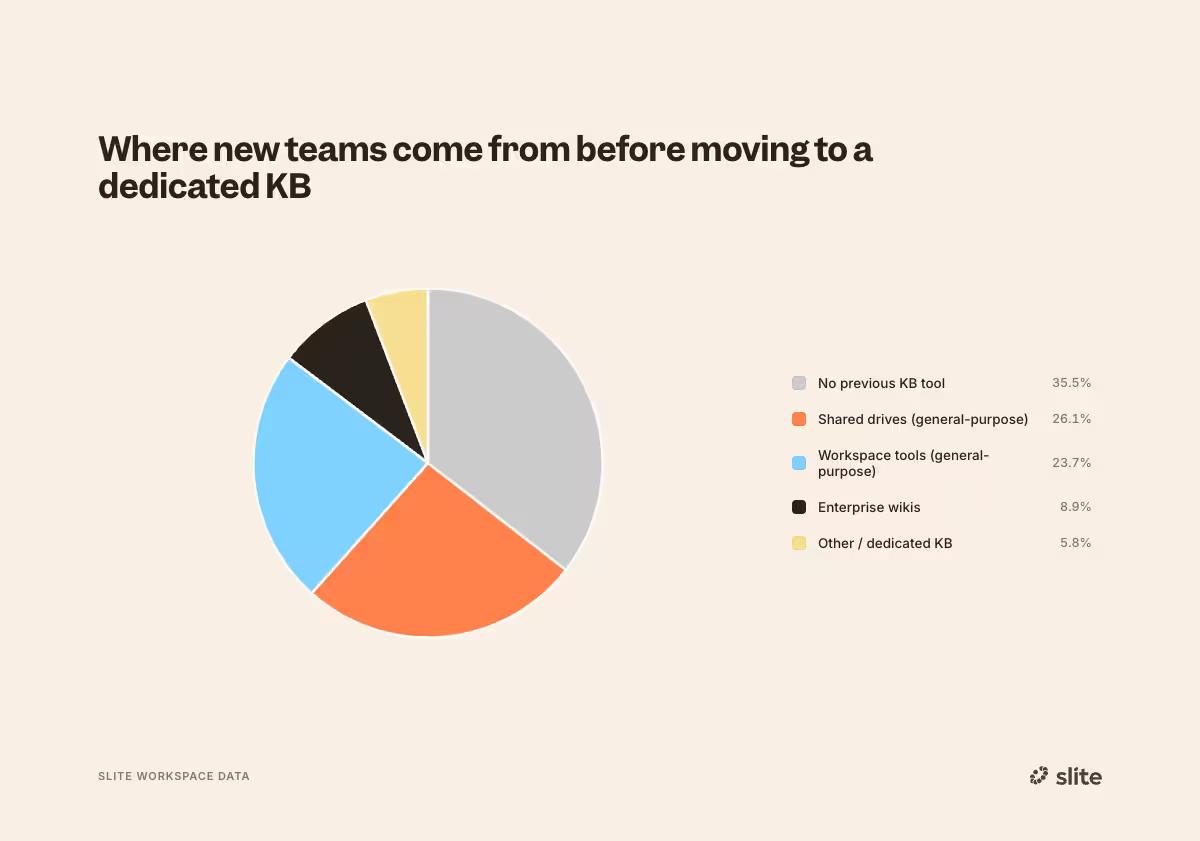
The migration data tells the same story from upstream. 35.5% of new workspaces had no previous KB tool at all.
Of teams that have migrated to Slite with prior tooling could be broken down into:
- general-purpose shared drives were the single biggest source (26.1%),
- followed by general-purpose workspace tools (23.7%),
- and then enterprise wikis (8.9%).
Most of the movement we see is away from general-purpose tools that started as docs and then sprawled, rather than from one dedicated knowledge base to another.
Stacked together, the three datasets say the same thing: Knowledge management is maintenance behavior.
Maintenance behavior is the first thing humans skip when a system can absorb it for them.
The teams that churn aren't lazy. They hit the maintenance wall that every long-lived KB eventually hits, and the wall won.
The teams migrating from shared drives and general-purpose workspaces are doing the same thing one product cycle earlier, looking for a system that does more of the work for them.
The next generation of knowledge bases won't be judged on how much they let your team write. They'll be judged on how much writing, organizing, and updating they remove from your team's calendar.
Conclusion
For months our customer success and sales teams have been hearing the same things on calls with KB owners.
"Nobody's touching the wiki."
"It's three people writing for everyone else."
"We can't keep it current."
We were nodding along, building toward the same conclusion in product, but until we ran this telemetry we didn't have hard numbers behind any of it.
Now we do. The data lines up almost exactly with what the customer base has been telling us. Writing is concentrated to a few people. The corpus compounds into a static archive. The median user has shifted from author to consumer. The maintenance habit is the first thing to crack.
The direction we've been building toward at Slite, a self-maintaining knowledge base, follows directly from those four findings.
- The few writers who carry the load deserve to be amplified, not asked to do more.
- The static corpus needs a system that can keep it fresh without a human in the loop for every edit.
- The median user who just wants an answer needs retrieval that works the first time.
- And the maintenance bill that breaks every other KB eventually has to be absorbed by the product, not added to a list of someone's quarterly goals.
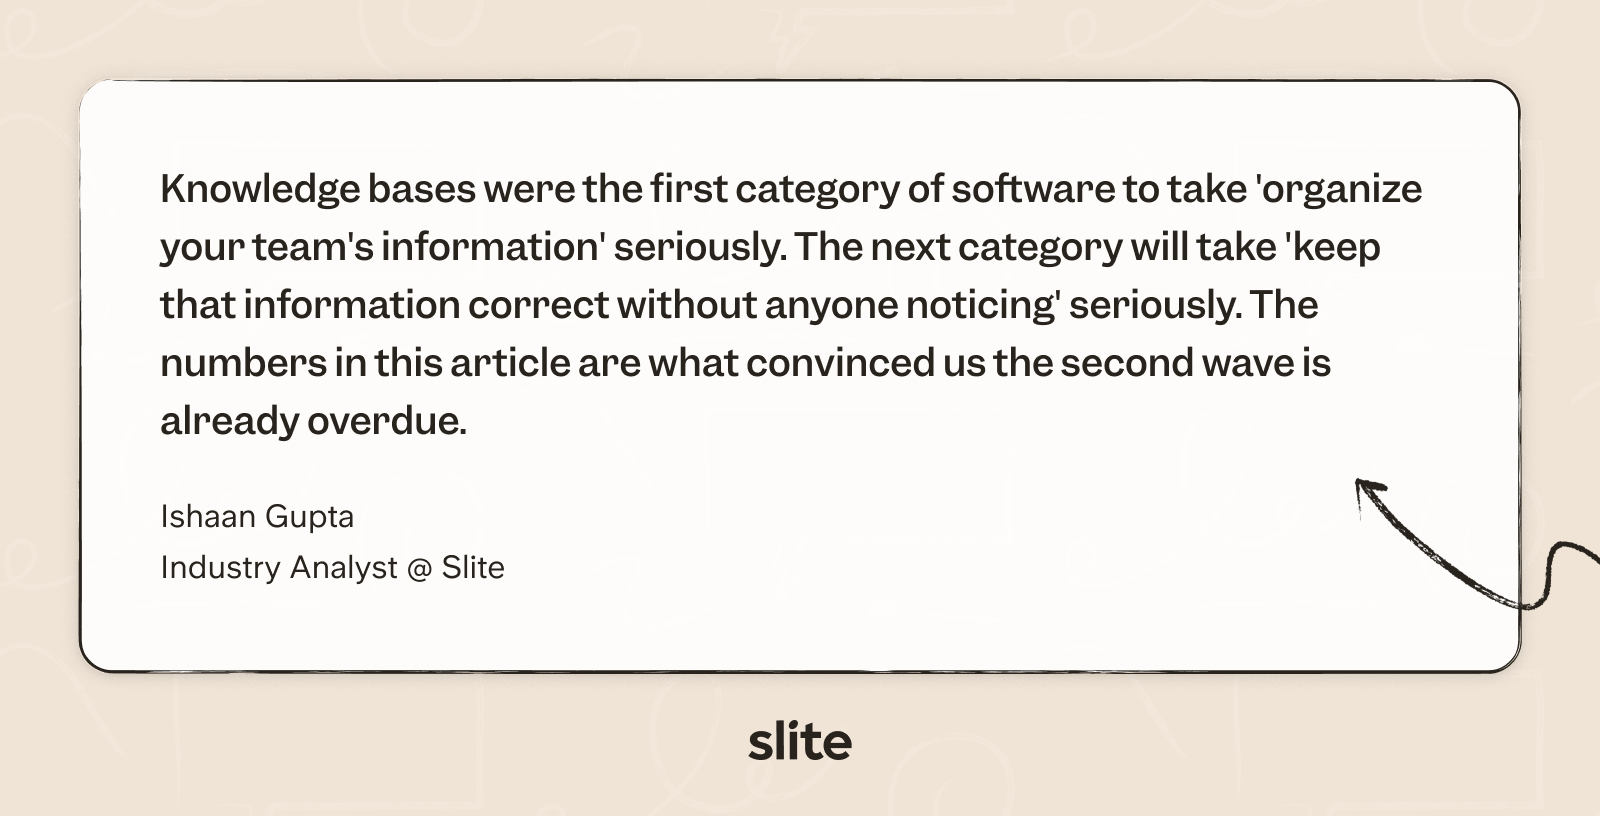
Ishaan Gupta, who tracks the AI knowledge-work shift across the category, had this to say:
If you want to see what a self-maintaining knowledge base looks like inside a real workspace, book a walkthrough and we'll happily show you around.
Where do I find this in Slite?
Each of the metrics in this piece surfaces inside the workspace analytics for Slite users. A short tour for owners who want to run the same numbers against their own workspace.
Where can I see how long it's been since a doc was verified?
Verification status sits in the doc header and in the workspace knowledge management panel. Filters for verified, expired, and never-verified make it triageable in one pass.
Where can I see which docs nobody has opened in the last 90 days?
The inactive doc filter inside the knowledge management panel surfaces docs with zero opens against a rolling 90-day window.
Where can I see who the top contributors are in my workspace?
Workspace analytics, contributors view. Same data shape used in the contributor concentration chart above, scoped to your own team.
Where can I see how often AI search is being used and what's going unanswered?
Ask Insights inside workspace analytics. Question volume, top topics, unanswered questions, and the channel breakdown across the web app, the Chrome extension, Slack, and the API.
Where can I see whether new hires have opened their onboarding docs?
Go to Insights on a doc.
Where can I see which docs are empty or abandoned?
The knowledge management panel exposes empty, outdated, and inactive filters side by side so you can clean in one sweep.
Where can I see how queries split between the app, Chrome extension, Slack, and the API?
This feature will become publicly accessible August 2026; until then contact customer support to help gain insights.
Last updated: May 2026